

AgencyRoot is a management system built for crop insurance. We simplify the crop insurance process, creating a shared digital workspace that services all AIP's.
United States
Joined February 2016
- Tweets608
- Following314
- Followers489
- Likes566
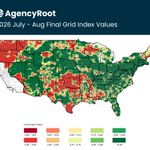


🌦️ FINAL RAINFALL INDEX MAP (July-Aug 2026)
See where payments triggered:
🔴🟠 = $ at lower coverage levels
🟡 = $ at higher coverage levels
🟢 = $ at highest coverage levels
Darkest green = ❌ $
na2.hubs.ly/H09239B0
#cropinsurance #RainfallIndex


43
🌞Estimated Rainfall Index Map
Est Setp-Oct 2026 Interval map is below showing all areas that estimate payments.
🔴🟠= $ at lower coverage levels ☀️
🟡= $ at higher coverage levels 🌦️
🟢= $ at highest coverage levels ⛈️
#agencyroot #cropinsurance

🌞Estimated Rainfall Index Map
Est July-Aug 2026 Interval map is below showing all areas that estimate payments.
🔴🟠= $ at lower coverage levels ☀️
🟡= $ at higher coverage levels 🌦️
🟢= $ at highest coverage levels ⛈️
#agencyroot #cropinsurance

🌦️ FINAL RAINFALL INDEX MAP (May-June 2026)
See where payments triggered:
🔴🟠 = $ at lower coverage levels
🟡 = $ at higher coverage levels
🟢 = $ at highest coverage levels
Darkest green = ❌ $
na2.hubs.ly/H07B6Rw0
#cropinsurance #RainfallIndex


AgencyRoot retweeted

This is exactly right. Source code is on the verge of becoming like assembly.
The next step is getting rid of “source code” entirely and just making an efficient binary directly with AI.

🌦️ FINAL RAINFALL INDEX MAP (Apr-May 2026)
See where payments triggered:
🔴🟠 = $ at lower coverage levels
🟡 = $ at higher coverage levels
🟢 = $ at highest coverage levels
Darkest green = ❌ $
na2.hubs.ly/H071lL20
#cropinsurance #RainfallIndex


89
🌞Estimated Rainfall Index Map
Est June-July 2026 Interval map is below showing all areas that estimate payments.
🔴🟠= $ at lower coverage levels ☀️
🟡= $ at higher coverage levels 🌦️
🟢= $ at highest coverage levels ⛈️
#agencyroot #cropinsurance

58
🌦️ FINAL RAINFALL INDEX MAP (Mar-Apr 2026)
See where payments triggered:
🔴🟠 = $ at lower coverage levels
🟡 = $ at higher coverage levels
🟢 = $ at highest coverage levels
Darkest green = ❌ $
na2.hubs.ly/H06xN390
#cropinsurance #RainfallIndex


1
135
🌞Estimated Rainfall Index Map
Est May-June 2026 Interval map is below showing all areas that estimate payments.
🔴🟠= $ at lower coverage levels ☀️
🟡= $ at higher coverage levels 🌦️
🟢= $ at highest coverage levels ⛈️
#agencyroot #cropinsurance

143
🌞Estimated Rainfall Index Map
Est Apr-May 2026 Interval map is below showing all areas that estimate payments.
🔴🟠= $ at lower coverage levels ☀️
🟡= $ at higher coverage levels 🌦️
🟢= $ at highest coverage levels ⛈️
#agencyroot #cropinsurance

58
🌞Estimated Rainfall Index Map
Est Mar-Apr 2026 Interval map is below showing all areas that estimate payments.
🔴🟠= $ at lower coverage levels ☀️
🟡= $ at higher coverage levels 🌦️
🟢= $ at highest coverage levels ⛈️
#agencyroot #cropinsurance

🌦️ FINAL RAINFALL INDEX MAP (Jan-Feb 2026)
See where payments triggered:
🔴🟠 = $ at lower coverage levels
🟡 = $ at higher coverage levels
🟢 = $ at highest coverage levels
Darkest green = ❌ $
na2.hubs.ly/H05pDb90
#cropinsurance #RainfallIndex


We’re in Frisco for the @CIPAToday Spring Meeting this week and already off to a great start.
Looking forward to a few days of great conversations and connecting with the people shaping crop insurance. If you’re here, come find us. We’d love to chat. #cropinsurance


1
74
🌞Estimated Rainfall Index Map
Est Feb-Mar 2026 Interval map is below showing all areas that estimate payments.
🔴🟠= $ at lower coverage levels ☀️
🟡= $ at higher coverage levels 🌦️
🟢= $ at highest coverage levels ⛈️
#agencyroot #cropinsurance

🌦️ FINAL RAINFALL INDEX MAP (Oct-Nov 2025)
See where payments triggered:
🔴🟠 = $ at lower coverage levels
🟡 = $ at higher coverage levels
🟢 = $ at highest coverage levels
Darkest green = ❌ $
na2.hubs.ly/H03wqvl0
#CropInsurance #RainfallIndex


1
104
Faster MPCI quoting. Clearer grower conversations.
Join us Feb 5 for a live webinar on using QuotePro+CountyPro to build side-by-side MPCI quotes in minutes and bring 30+ years of county history into ECO and SCO discussions. Free to attend.
👉 Register: na2.hubs.ly/H03jPRX0

1
97
🌞Estimated Rainfall Index Map
Est Nov-Dec 2025 Interval map is below showing all areas that estimate payments.
🔴🟠= $ at lower coverage levels ☀️
🟡= $ at higher coverage levels 🌦️
🟢= $ at highest coverage levels ⛈️
Darkest Green =❌$
#AgencyRoot #CropInsuranceSmarter

87
🌦️ FINAL RAINFALL INDEX MAP (Sept-Oct 2025)
See where payments triggered:
🔴🟠 = $ at lower coverage levels
🟡 = $ at higher coverage levels
🟢 = $ at highest coverage levels
Darkest green = ❌ $
na2.hubs.ly/H02TBpT0
#CropInsurance #RainfallIndex

66
On Day 11, we're highlighting CommissionPro, our powerful commission management tool. See how you can streamline expected commissions, track agent splits, and reduce manual work.
52