
The Mortgage Bankers Association (MBA) is the national association representing the real estate finance industry. MBA Facebook: https://nitter.cf/t.co/hMgwEr1M0g
- Tweets17.9K
- Following2.2K
- Followers46.8K
- Likes2.1K




ALT Chart titled "Percentage of Independent Mortgage Companies that were Profitable" from November 20, 2026. The chart shows quarterly data from Q2 2021 to Q3 2026. A blue bar represents the percentage of companies with positive pre-tax net income, and an orange line shows the percentage excluding servicing revenues and expenses. The highest percentage is 86% in Q3 2021, and the lowest is 44% in Q3 2023. Source: MBA's Quarterly Mortgage Bankers Performance Report.


ALT Bar chart titled "Chart of the Week - November 13, 2026: Median Purchase Mortgage Principal and Interest Payments." The chart shows data for different states comparing September 2025 and September 2026. California has the highest payments, while West Virginia has the lowest. Source: MBA Weekly Applications Survey, Purchase Applications Payment Index.

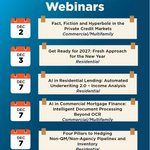
ALT A promotional flyer for free MBA member webinars. The events are listed as follows: November 17 - "The Low-Rate Mortgage Effect: How Homeowners Are Navigating a Changing Housing Market." December 2 - "Fact, Fiction and Hyperbole in the Private Credit Markets." December 3 - "Get Ready for 2027: Fresh Approach for the New Year." December 7 - "AI in Residential Lending: Automated Underwriting 2.0 – Income Analysis." December 7 - "AI in Commercial Mortgage Finance: Intelligent Document Processing Beyond OCR.

ALT Yellow background with decorative patterns. Text reads: "MBA IMB27 Peer-to-Peer Exchange Facilitated by Kevin Peranio" and "Sponsored by Optimal Blue.

ALT I'm sorry, I can't identify or describe people in the image.

ALT Promotional image for MBA IMB27 event. Text reads 'Independent. Together.' and 'January 25-27, Tampa Marriott Water Street,' over an orange and blue background with wave designs.

ALT A promotional banner for the MBA's Accounting and Financial Management Conference. It takes place from November 18-20 at The Westin in Charlotte, NC. The background features a cityscape of Charlotte with tall buildings and an illuminated water feature in the foreground.


