









ALT An illustrated diagram from the Review Article "Helicobacter pylori Infection — Advances, Challenges, and the Road Ahead" that shows culture-based and molecular-based antimicrobial-susceptibility testing for H. pylori.

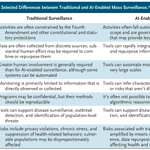
ALT Selected differences between traditional and AI-enabled mass surveillance are presented in a table with two columns. Categories such as regulation, data integration, automation, and public health risks are compared between the two surveillance types: "Traditional Surveillance" and "AI-Enabled Surveillance."

ALT Three panels showing the changes from baseline in 24-hour urinary protein-to-creatinine ratio. Panel A is a bar chart that shows the change from baseline in the 24-hour urinary protein-to-creatinine ratio at week 34 (primary end point). Panel B is a graph shows the change from baseline in the 24-hour urinary protein-to-creatinine ratio at weeks 10, 26, and 34; from the mixed model for repeated measures. Panel C is a bar chart that shows the percentage of patients with a 50% or greater reduction from baseline in the 24-hour urinary protein-to-creatinine ratio at weeks 10, 26, and 34.


ALT The image is page 1 of the Public Health Alerts report "Outcomes among Pregnant Women with Measles and Their Infants in the United States — Preliminary Analysis, 2025–2026" published in NEJM Evidence in partnership with Center for Infectious Disease Research and Policy (CIDRAP) at the University of Minnesota. A slate banner at the bottom encourages readers to access the full report at evidence.nejm.org.

ALT This image is a composite of multiple panels showing interferon-γ–associated tissue inflammation and therapeutic responses in thymoma-associated immune dysregulation. Panel A displays histologic analysis images of esophagus, duodenum, and bone marrow tissues at various magnifications. Panel B is a scatter plot showing serum CXCL9 levels in 34 study patients. Panel C has graphs illustrating changes in CXCL9 and IFN-γ expression upon cyclosporine treatment. Panel D shows serum CXCL9 levels and clinical response in Patient 1. Panel E presents the frequency of oral candidiasis episodes in Patient 2. Panel F contains line graphs of hemoglobin and albumin levels in Patient 3.

ALT A quote from an NEJM Voices blog post reads as follows: “Cancer is a social disease. If we, as oncologists and other health care providers who see people with cancer, are committed to improving the quality of life following a cancer diagnosis, we need to see intimate partners as patients too.” The author is Don Dizon, M.D. The background color is blue and includes the NEJM Voices logo.

ALT This image contains an excerpt from the Research Summary "Prevention of VTE after Total Hip or Knee Replacement” published in the New England Journal of Medicine. It shows a diagram of venous thromboembolism after total hip or knee arthroplasty. Three medications are compared: aspirin, warfarin, and rivaroxaban, with participant numbers listed for each. A prompt to read the full Research Summary at NEJM.org sits at the bottom.

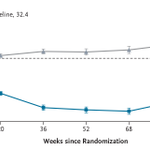
ALT Graph showing percent change in BMI over 104 weeks since randomization. Two lines are displayed: "Semaglutide" in blue and "Placebo" in gray. Mean BMI at baseline is 32.4. I bars indicate standard errors.

ALT An illustration of a physician and patient sitting and talking in a hospital room, with the title "An Element Out of Place" at the top. Medical equipment is faintly visible in the background.

ALT Panel A is a map of Africa showing countries where seasonal malaria chemoprevention is deployed, including Mauritania, Mali, Burkina Faso, Niger, Nigeria, Chad, Cameroon, Senegal, Gambia, Guinea-Bissau, Guinea, Ivory Coast, Benin, Togo, Ghana, and South Sudan. The chart in Panel B is titled "Seasonal Malaria Chemoprevention in African Children 3 to 59 Months of Age," illustrating a rising trend from 2012 to 2024 in the number of children covered.

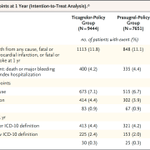
ALT A table showing the clinical end points at 1 year (intention-to-treat analysis). It compares two groups: Ticagrelor-Policy Group (9444 patients) and Prasugrel-Policy Group (7651 patients). Primary end point shows 1113 events in the Ticagrelor-Policy Group and 848 in the Prasugrel-Policy Group. Secondary end points are listed, including death from any cause, myocardial infarction, stroke, major bleeding, and stent thrombosis, with corresponding patient numbers and percentages for each group. Odds ratios with confidence intervals are provided.

ALT A visual representation of the I CAN trial, which tested whether ravulizumab reduces the 24-hour urinary protein-to-creatinine ratio for patients with IgA nephropathy.

ALT This image contains an excerpt from the Research Summary “Rivaroxaban Then Aspirin vs. Aspirin Alone after Hip or Knee Arthroplasty” published in the New England Journal of Medicine. It includes diagrams of total arthroplasty for knees and hips, and a cross-section illustrating venous thromboembolism. Below, there are details about the two treatment groups: "Aspirin Alone" with 81 mg daily, and "Rivaroxaban–Aspirin" with 10 mg rivaroxaban for 5 days, followed by 81 mg aspirin daily. Aspirin images accompany each regimen, with N=2718 for Aspirin Alone and N=2647 for rivaroxaban–aspirin. A prompt to read the full Research Summary at NEJM.org sits at the bottom.

ALT Graph titled "Interferon Autoantibodies in a Patient with Fatal H7N7 Infection." It shows luciferase activity percentages on a logarithmic scale from 10^-1 to 10^3 for three groups: Interferon-α, Interferon-ω, and Interferon-β. Data points include red triangles for the patient, purple circles for healthy donors, and black circles for the positive control.

ALT Four medical images from this week's Image Challenge showing ulcers and large hemorrhagic bullae on a patient's left hand.

ALT This image displays samples from CT-guided core biopsy of a lesion in the right iliac crest. Panels A and B: Hematoxylin and eosin staining shows a diffuse infiltrate of large atypical lymphoid cells with ovoid-to-irregular nuclei, vesicular chromatin, and prominent nucleoli. Panel B shows magnification at six times that in Panel A. Panel C: Immunohistochemical staining shows that the lymphoid cells were diffusely positive for the B-cell marker CD20. Panel D: The percentage of cells staining for Ki-67, a marker of proliferation, was markedly increased (>90% of cells), a finding consistent with an aggressive cancer. Panels C and D both show magnification at four times that in Panel A.

ALT A diagram with four quadrants categorizing risk factors based on baseline bleeding and wound-complication risk (y-axis) and baseline VTE risk (x-axis). - Top left: "Standard VTE risk, high bleeding risk," suggesting "Favors Aspirin." - Top right: "High VTE risk, high bleeding risk," advising "Individualize." - Bottom left: "Standard VTE risk, standard bleeding risk," indicating "Aspirin May Be Appropriate." - Bottom right: "High VTE risk, standard bleeding risk," recommending "Favors Anticoagulation." Axes labeled with thresholds as uncertain.

ALT Illustration depicting the comparison of the medications prasugrel and ticagrelor, shown in labeled bottles with pills, for patients with an acute coronary syndrome.

ALT Graphs showing patient survival rates over time in the phase 3 INTerpath-001 trial. Panel A represents recurrence-free survival, while Panel B shows distant-metastasis-free survival. Each graph compares intismeran–pembrolizumab (blue line) with placebo–pembrolizumab (gray line). X-axis denotes time in months, and Y-axis shows the percentage of patients. Tables below each graph detail the number of patients at risk at various time points.

ALT A quote from an NEJM Voices blog post reads as follows: “The real value of time is not what an accountant may bill for it, but rather the value of what could have been done instead.” The author is Theodore Iwashyna, M.D. The background color is slate and includes the NEJM Voices logo.