

The Sentimentrader Advantage: Over 20 years of exclusive, data-driven insights and unrivaled market sentiment tools.
Minnesota, USA
Joined July 2007
- Tweets4.6K
- Following717
- Followers27K
- Likes4.5K






A historically strong seasonal window for the S&P 500 just opened, running from the October 28 close through November 4. Over 77 years, gains of at least 3% have outnumbered comparable losses 15 to 2. It is a tendency, not a promise: 2022 closed this same window down 2.3%.
Six reports this week. Weight of Evidence: Constructive, selective.
U.S. Stocks • France • Seasonal • Discretionary • Silver
Read the full Weekly Research Signals: us2.campaign-archive.com/?u=…

Rough week for stocks. The calendar has usually offered a little relief right about here.
The last two trading days of October and the first three of November have been one of the year's more reliable stretches. Over 77 years, the S&P 500 rose through this window roughly 3 years out of 4, with big gains of 3% or more outnumbering big losses 15 to 2.
This week's TradingEdge Weekly video covers the power period, yuan strength as a tailwind for US stocks, French equities at an oversold extreme, and fourth-quarter sector seasonality.
The full SentimenTrader market view: youtu.be/3UixT8K84oA
Read more: sentimentrader.com/blog/trad…

The gap is nearly gone.
On Oct. 23, $WCLD Optix was 89.33 vs. 30.72 for $QQQ. By Oct. 29, WCLD had dropped to 40.44, while QQQ was at 33.11.
Nearly all of that came from cloud sentiment falling, not Nasdaq sentiment improving.
sentimentrader.com/?utm_sour…


Cloud computing stocks are still climbing, but the sentiment gap with the Nasdaq 100 has narrowed.
On Oct. 23, $WCLD sentiment stood 58.6 points above $QQQ sentiment, a gap this wide seen on just six trading days since October 2019.
By Oct. 26, that gap had shrunk to 34.8 points.
sentimentrader.com/?utm_sour…

Equal weight $RSP gained 1.2% on Oct. 29, while the S&P 500 fell 0.3%.
RSP sentiment rose to 78.2, versus 39.9 for $SPY and 33.1 for $QQQ.
The 38.3-point RSP vs. SPY sentiment gap has been this wide on just 6 trading days since 2008.
sentimentrader.com/?utm_sour…

Materials breadth snapped back Thursday.
The share of $XLB stocks above their upper Bollinger Band jumped from 4.17% to 33.33%. That 29-point rise ranks in the top 0.6% of daily changes since 2008. XLB rose 1.29% as the S&P 500 fell 0.30%. It was 45.83% a week ago, though.
sentimentrader.com/?utm_sour…

Healthcare, tech, and industrials have all entered historically favorable seasonal windows.
Only one clearly has price on its side.
Healthcare $XLV has led since its late-April low, and insiders are more bullish on it than on any other sector. Tech $XLK is trying to hold its 70-day EMA. Industrials $XLI have trended lower since August.
Read more: sentimentrader.com/blog/seas…

Health care isn’t just leading. It’s also entering a seasonally strong stretch.
This year, that window runs Oct. 27 through Dec. 15. Holding $XLV only during it each year since 1999 would have grown $1 to $2.82.
Price is cooperating, too. XLV is still above its 70-day EMA.
sentimentrader.com/blog/seas…


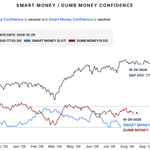
Smart Money / Dumb Money Confidence (2026-10-29)
• Smart Money 0.57 | Neutral
• Dumb Money 0.52 | Neutral
Track the latest Smart & Dumb Money Confidence on SentimenTrader: sentimentrader.com/?utm_sour…

SLV shares keep climbing into the decline, but inflows haven't marked bottoms. In 30 similar setups since 2007, the two-month median return was -2.8%. What mattered: whether five-day price momentum had already turned.
sentimentrader.com/blog/silv…


Silver ETF Alert
Shares outstanding continue to grow. SLV (iShares Silver Trust) increased 1.5 million shares or approx 1.35 million ounces today. Total 553,300,000 shares outstanding.
This is now a new high since the March 10, 2026 when shares outstanding was 555,600,000 and the silver price was $30 higher.
Silver market could be at a point where the short side has pressed the market to a point hoping the longs would capitulate. Instead, capital inflows int the Silver ETF continue. We could see a rally develop as the supply of offers begin to dry up. Meaning those that are short may not have the liquidity to get out if prices start to rise.

The trust behind $SLV kept adding silver as the price slid toward a 1-year low. Easy to read that as big money buying low.
Price has been the more useful clue.
When SLV's holdings momentum turned negative near a 1-year low, 7 of 8 cases with a positive 5-day price change were higher a month later. When price was flat or falling, the results were far weaker. SLV's 5-day change is still negative.
Read more: sentimentrader.com/blog/silv…

$EIS fell 4.86% on Oct. 28, while sentiment toward Israeli stocks plunged from 86.28 to 15.32.
That's the largest single session sentiment drop in 1,966 daily changes since 2019.
sentimentrader.com/?utm_sour…

Consumer Discretionary has lagged for a year. Its Panic Breadth Composite just triggered for the 7th time since 2000. In all 6 prior cases, $XLY was higher 6 and 12 months later. Median one-year gain: +19.55%.
The catch: it's still below its 200-day.
Read more: sentimentrader.com/blog/the-…

Smart Money / Dumb Money Confidence (2026-10-28)
• Smart Money 0.57 | Neutral
• Dumb Money 0.5 | Neutral
Track the latest Smart & Dumb Money Confidence on SentimenTrader:
sentimentrader.com/?utm_sour…

High yield bond sentiment reached 81.52 on Oct. 27, nearly 30 points above $SPY sentiment.A gap this wide has occurred on just 47 of 1,966 trading days since 2019.
sentimentrader.com/?utm_sour…

Just 30% of CAC 40 stocks are above their 200 day moving averages, leaving French market breadth more than 30 percentage points behind the S&P 500.
After similar signals, the S&P 500 was higher a year later 89% of the time.
Read more: sentimentrader.com/blog/the-…

The S&P 500 has averaged a 1.23% gain over October's last 2 trading days and November's first 3 since 1949, versus just 0.18% across all 5 day periods. It rose in 56 of 77 years.
This year's stretch runs from the Oct. 28 close through the Nov. 4 close.
Read more: sentimentrader.com/blog/the-…

Brazil’s election result sent $EWZ plunging 19.8% on Oct. 26.
IBOV 12 Week Low % surged from 1.3% to 67.1% in a single session, while Brazil Optix collapsed from 68.1 to just 2.1.
sentimentrader.com/?utm_sour…

$QQQ can have an oversold RSI reading even when most of its holdings aren't oversold.
There's a big difference between a handful of stocks with RSI below 30 and a broad wave of oversold readings.
RSI breadth lets you see that difference and check how QQQ performed after similar readings in the past.
sentimentrader.com/?utm_sour…
Qatar sentiment flipped in a single session.
Qatar sentiment jumped from 14.93 to 74.96 on Oct. 26, while Saudi Arabia sentiment rose from 21.42 to 38.28.
$QAT bounced, but it's still near the low end of its six-month range.
sentimentrader.com/?utm_sour…

Cloud computing stocks are still climbing, but the sentiment gap with the Nasdaq 100 has narrowed.
On Oct. 23, $WCLD sentiment stood 58.6 points above $QQQ sentiment, a gap this wide seen on just six trading days since October 2019.
By Oct. 26, that gap had shrunk to 34.8 points.
sentimentrader.com/?utm_sour…