

Next generation Agentic-AI RMM / DEX. Built with AI as a bedrock from the ground up.
- Tweets330
- Following199
- Followers34
- Likes304
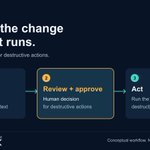





ALT Dark navy diagram titled "Review the change before it runs." Subtitle: "Human approval for destructive actions." Three connected steps show Investigate, using live device state and endpoint context; Review + approve, a human decision for destructive actions; and Act, running the approved destructive action. The middle step has an amber outline. Tassient Aipex branding appears in the footer. Label: Conceptual workflow. Not a product screenshot.

ALT Graphic titled "Check the edition, too." for Windows 11, version 24H2. Two cards compare Home and Pro, which reached end of updates in October 2026, with Enterprise and Education, supported into 2027 with end of updates in October 2027. Below: Review support dates in Aipex under Details, Operating system, and in the dashboard lifecycle widget, where lifecycle data is available. Tassient Aipex logo in the footer. Status checked November 2, 2026; source: Microsoft Windows lifecycle guidance.

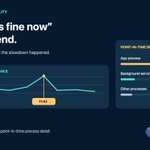
ALT Dark navy Sunday on-call graphic headed “When ‘it’s fine now’ isn’t the end.” Text advises going back to the moment the slowdown happened. An illustrative historical CPU chart highlights a spike at 11:42. A point-in-time detail panel shows App process 62%, Background service 21%, and Other processes 17%. Footer: Aipex historical performance plus point-in-time process detail, beside the official Tassient logo.

ALT Dark navy graphic headed “Don’t stop at the alert.” Four connected circular illustrations show an amber warning beacon labeled Signal, monitoring charts labeled Context, a network of cubes labeled Cause, and a laptop with a check mark labeled Verified fix. The official Tassient logo appears beneath the sequence.

ALT Dark navy Saturday maintenance prep graphic headed “Build the baseline before the window opens.” Text says to know what the device is and how it is behaving before changing it. A “One device. Two views.” panel compares configuration—hardware, operating system, applications, users and sessions—with behavior—CPU and memory, network, processes and services, historical context. Footer: Aipex inventory plus live and historical monitoring, beside the official Tassient logo.

ALT Dark navy Friday troubleshooting graphic headed “Several users. One shared dependency?” Text advises checking service status before changing each endpoint. A diagram titled “Look for shared context” connects User 1, User 2 and User 3 to a shared service labeled “Check provider status.” Footer: Aipex dashboard, cloud provider status widgets plus known-outages overlay, beside the official Tassient logo.

ALT Dark navy Thursday evaluation lab graphic headed “Start with 10. Test the full workflow.” Text states Aipex Free includes the full feature set for up to 10 devices. Ten monitor icons sit beside a feature panel: Inventory—know what is deployed; Monitoring—see live and historical context; Remote support—control, shell and file tools; Automation—run and trigger scripts; Agentic AI—investigate with device context. Footer: Start small. Test the workflow. Plan the rollout. Official Tassient logo at bottom right.

ALT Dark navy Wednesday inventory graphic headed “Software name is only the start.” It advises checking version, publisher and scope before deciding what to do. An illustrative application table lists Design Tool 8.4.2 on 126 devices, Browser 132.1 on 318, Support Client 5.7.0 on 84 and PDF Reader 24.9 on 211, with example publishers. Footer: Aipex application inventory with organization-wide scope and per-device detail, beside the official Tassient logo.

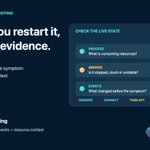
ALT Dark navy Tuesday troubleshooting graphic headed Before you restart it, read the evidence. A restart can clear the symptom and erase useful context. A Check the live state panel lists Process: What is consuming resources? Service: Is it stopped, stuck or unstable? Events: What changed before the symptom? Below: Observe, connect, then act. Footer: Aipex live monitoring—processes, services, events and resource context—beside the official Tassient logo.

ALT Dark navy Monday network triage graphic headed Slow is a symptom. Build the diagnosis. Text advises reading the signal in layers and comparing changes over time. A Follow the network signal panel lists Wi-Fi signal—connection quality; latency targets—response time; interfaces—path and state; connections—active traffic. An illustrative amber history chart sits beside the list. Footer: Aipex, live and historical network context on the device, beside the official Tassient logo.