




Pinned Tweet
The world's income map has shifted since 1987.
Low-income countries went from 30% to 11%
High-income economies went from 25% to 41%
Learn more with the recently launched 2026-2027 @WorldBankGroup Country Income Classifications: blogs.worldbank.org/en/opend…

Poverty.
Food security.
Jobs.
Governance.
Energy.
Agriculture.
Innovation.
The October 2026 World Development Indicators update brings new and revised data across the development agenda.
See what’s new and explore the data: blogs.worldbank.org/en/opend…

Sub-Saharan Africa's cities are growing fast, but their economic potential remains largely untapped.
New @WorldBankgroup report outlines a three-pillar framework to drive growth, attract investment, and create jobs: openknowledge.worldbank.org/…

Global commodity prices are forecast to rise 23% in 2026 as conflict drains oil inventories and leaves markets exposed to new shocks.
The #CMO2026 shows energy, food, and metals prices all under pressure.
➡️ worldbank.org/commodities

Progress against extreme poverty has stalled.
At the current trajectory, global extreme poverty will be higher in 2030 than today. What will it take to change course?
Explore the findings from new @WorldBankGroup #3PR: worldbank.org/en/publication…

Nearly one in five people worldwide are estimated to be at high risk from climate hazards.
The new PARCH map lets you explore where exposure to floods, droughts, heatwaves and cyclones overlaps with poverty and other vulnerabilities.
Explore the map: blogs.worldbank.org/en/opend…

Extreme poverty is falling—but becoming increasingly concentrated.
New @WorldBankGroup research covering 154 economies and 96% of the global population shows who remains in extreme poverty, where they live, and why progress is becoming harder.
Read: blogs.worldbank.org/en/opend…

Global commodity prices are forecast to rise 23% in 2026 as conflict drains oil inventories and leaves markets exposed to new shocks.
The #CMO2026 shows energy, food, and metals prices all under pressure.
➡️ worldbank.org/commodities
Poverty reduction has stalled, but that doesn't make it intractable. More jobs, better-paid jobs, and sustained economic growth where poverty is highest can help correct course.
Explore our new @WorldBankGroup #3PR: worldbank.org/en/publication…

Almost 6 in 10 people globally live in areas exposed to climate-related hazards.
But exposure alone does not determine risk.
In 2024, 1.5 billion people were both exposed and vulnerable, making climate shocks harder to withstand and recover from: blogs.worldbank.org/en/opend…

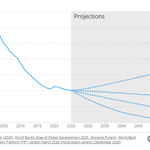
1950: 60% of the world lived in extreme poverty.
2025: 10%.
One of the biggest development gains of the past 75 years.
But progress has stalled—and the path to 2050 is far less certain.
Five facts from the data: blogs.worldbank.org/en/opend…

World Bank Data retweeted

Our “Poverty, Prosperity and Planet Report 2026” is out!
Jobs at the center of Poverty Eradication.
worldbank.org/en/publication…

The latest @WorldBankGroup #EAPUpdate finds that #AI is most effective at supporting jobs that require complex thinking and judgment, yet only 13% of jobs in East Asia and Pacific fall into this category, compared to 39% in advanced economies. Learn more: worldbank.org/en/publication…

Only about 23% of workers in economies impacted by fragility, conflict or violence (FCV) were in salaried employment in 2025, compared with 47% across other economies overall.
See what the 2026 World Bank Group Scorecard update reveals: blogs.worldbank.org/en/opend…

Firms in high-income economies innovate more—and productivity is more evenly distributed.
28% introduced a new product or process, vs. 16% in low- and lower-middle-income economies.
What the first complete global Enterprise Surveys cycle reveals: blogs.worldbank.org/en/opend…

Poverty.
Food security.
Jobs.
Governance.
Energy.
Agriculture.
Innovation.
The October 2026 World Development Indicators update brings new and revised data across the development agenda.
See what’s new and explore the data: blogs.worldbank.org/en/opend…

Cities can connect workers to more firms, occupations, and opportunities.
But when housing and transport costs absorb the urban wage premium, density stops delivering on its promise.
Good urban planning is also jobs policy: blogs.worldbank.org/en/opend… #WBGAtlas

Did you know that data sharing initiatives can generate an estimated US$5 in social returns for every dollar invested.
But realizing that value takes more than APIs and platforms.
Check our five-part roadmap for turning government data into public value: blogs.worldbank.org/en/opend…

The latest @WorldBankGroup #EAPUpdate finds that #AI is most effective at supporting jobs that require complex thinking and judgment, yet only 13% of jobs in East Asia and Pacific fall into this category, compared to 39% in advanced economies. Learn more: worldbank.org/en/publication…

The food sector already sustains 1.3 billion jobs globally. As food demand grows it could create millions more.
#WBGAgriConnect is helping 300M farmers grow their businesses by 2030, opening up more opportunities for jobs and investment. Explore how: worldbank.org/en/news/immers…

Only about half of women ages 15–64 are engaged in income-generating work—around 30 percentage points below men.
That gap has barely changed since 1990.
The Atlas of Global Development 2026 looks beyond the global average: blogs.worldbank.org/en/opend… #WBGAtlas
