AnyChart (@AnyChart) header
AnyChart (@AnyChart) profile picture

Cross-Platform Data Visualization Tools 📊 JavaScript charts 📈 Qlik extensions ➕ more for #DataViz and #Analytics ✨ #qlik #javascript #frontend #webdev

Joined April 2009
Photo by AnyChart (@AnyChart)Photo by AnyChart (@AnyChart)Photo by AnyChart (@AnyChart)Photo by AnyChart (@AnyChart)Photo by AnyChart (@AnyChart)Photo by AnyChart (@AnyChart)Photo by AnyChart (@AnyChart)Photo by AnyChart (@AnyChart)Photo by AnyChart (@AnyChart)Photo by AnyChart (@AnyChart)
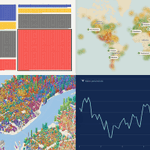
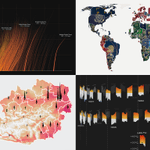
AnyChart JS 9.0.0 is out. It's a big one for new chart types. We've added 7, each for a specific job: » Dependency wheel & arc diagram: connections » Org chart: hierarchies » Stream graph & waffle: composition » Lollipop & dumbbell: comparisons And there's more. Give it a try.
1
119
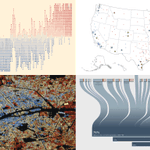
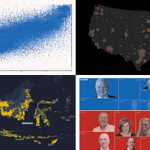
Your next chart could start here. See what others have been making. Recent projects we found most interesting, in the latest #DataViz Weekly: 🟢 Most connected actors 🟢 Spain's farmland & wildfires 🟢 India's arms to Europe 🟢 U.S. House race ratings anychart.com/blog/2026/10/30…
3
138
Visualize connections with dependency wheels. @AnyChart JS 9.0.0 adds dependency wheels to visualize weighted connections and highlight key relationships. componentsource.com/news/202…
1
2
43
A chart can look great and say nothing. The ones that stick with us do the work. #DataViz Weekly on our blog features that kind, made by others. New picks: 📌 Cyber risk by U.S. industry 📌 Fight for Congress 📌 Michigan debate on X 📌 Every dog in NYC anychart.com/blog/2026/10/23…
2
133
A "quick" glance at a chart. Ten minutes later, you're still looking. In DataViz Weekly, you'll find more like that, made by others. This time: 🟧 U.S. House battlegrounds 🟧 China's unused wind & solar 🟧 Paris buildings by age 🟧 Pacific sea temperatures anychart.com/blog/2026/10/16…
1
5
251
Saw a great chart last month? Can you still find it? #DataViz Weekly gathers examples like that. Latest two editions: » Problem gambling » U.S. school fixes » Earth's terrain » Every Berlin vote » Afterlife beliefs » Tariffs in Canada » Population pyramids » U.S. social life
1
1
6
271
Check out both editions of DataViz Weekly at anychart.com/blog.
1
47
AnyChart retweeted
One Qlik tenant, two fully customized hubs. Different brands, different content, same source, no duplicated apps. That’s NewHub for Qlik Cloud, now running @AnyChart's own environment. Want to poke around? DM me and I’ll send you access.
1
1
1
58
Behind many news stories sits a dataset that knows more than the headline 📊 This #DataViz Weekly, 4 newsroom projects that get it talking: 🔸 Anomalies in Russia’s vote 🔸 Biggest U.S. midterm donors 🔸 AI data center heat 🔸 Indonesia’s crops & forests anychart.com/blog/2026/09/25…
4
162
3
203
Everyone is busy making charts... Hey, wanna stop & look at anyone else's? That's the point of #DataViz Weekly, our standing roundup of good data viz. This time: » U.S. voters ahead of midterms » U.S. economy's mixed signals » Building ages, 100 cities » Travel weather worldwide
1
1
4
192
Check out the latest edition of DataViz Weekly and start wherever you like: anychart.com/blog/2026/09/18… Kudos to the creators! » The Economist » Reuters: @prinzmagtulis @annsaphir » Block and Paper » SeasonMap
1
51
AnyChart retweeted
Would you investigate a 22% KPI miss before a 4% miss? Suppose the 22% has run all year and the 4% just started. Only one of them is new information. 🔥 New guide to chart types for performance against target, the question each answers & the trap in each anychart.com/blog/2026/09/16…
2
3
108
Would you investigate a 22% KPI miss before a 4% miss? Suppose the 22% has run all year and the 4% just started. Only one of them is new information. 🔥 New guide to chart types for performance against target, the question each answers & the trap in each anychart.com/blog/2026/09/16…
2
3
108
Good data viz appears constantly. How much of it reaches you? #DataViz Weekly is our regular pick of what we found most interesting. This time: ◉ Hotter days by county 🇺🇸 ◉ Passports compared 🌐 ◉ Heat & hospital deaths 🇦🇹 ◉ Hajj dates & Makkah heat 🇸🇦 anychart.com/blog/2026/09/11…
1
4
149
AnyChart retweeted
Most BI dashboards report what happened. Almost none are built to answer why. Seven charts do that second job. And you rarely use just one. 💥 Just published a guide to chart types for root cause analysis, including the ways each one can mislead: anychart.com/blog/2026/09/02…
1
2
188
AnyChart retweeted
since you guys loved the exploding tesla.. I used GPT-6 Astra to create a 3D website that pulls apart the male anatomy into 2,234 modeled pieces! we are in a renaissance of learning
1,152
5,410
1,027
53,243
8,050,728
Your next chart could start with someone else's. DataViz Weekly brings you recent visualization projects as examples for your own work. Latest picks: ◆ Record U.S. heat & humidity ◆ How much of the web is AI ◆ Wages in Big Macs ◆ Premier League shirt sponsors
1
2
234
Explore all four in the latest edition, with a closer look at the visuals and where to explore the originals: anychart.com/blog/2026/09/04… Have a data viz project to share? Send it our way for a future edition 🤝
77
Most BI dashboards report what happened. Almost none are built to answer why. Seven charts do that second job. And you rarely use just one. 💥 Just published a guide to chart types for root cause analysis, including the ways each one can mislead: anychart.com/blog/2026/09/02…
1
2
188