

🔍 A platform for cryptocurrency order flow and futures contract data analysis. App download: https://nitter.cf/t.co/m9i18sfphu | Linktree: https://nitter.cf/t.co/0urkRbgMK6
Metaverse
Joined May 2021
- Tweets5K
- Following173
- Followers19.8K
- Likes2.7K





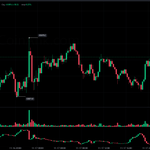

$BTC CRACKS $60K. NOW AT $59,451.
1H Hyperliquid chart.
Price is trading at $59,451, down 5.77%.
24h range is $58,725 – $63,387. Volume $6.61B, liquidations $488.09M, OI $2.35B, funding -0.0006%, L/S 0.94.
Price sold off hard and tagged a low near $58,725. The break below $60,000 was clean and decisive.
The structure shows a vertical dump with no meaningful bounce yet.


BTC NEAR $61.5K. MAX-STRENGTH ZONE SITS 3.57% ABOVE.
Price has dropped into the lower range.
Liquidation Radar shows 5 signals, 20/20 alerts active.
Strongest upper zone: $64,100 – $64,600, distance 3.57%, relative strength 100/100. Heat change +0.85%. Next is $65,300 – $65,450, distance 5.51%, relative strength 34/100.
Closest lower zone: $60,850 – $61,200, distance 1.11%, relative strength 69/100. Heat change +2.96%. Secondary layer at $60,500, distance 2.24%.
Peak intensity on the scale is 352.08M.

$BTC AT $62,111. TAGGED $61,207 LOW.
1H Hyperliquid chart.
Price is trading at $62,111, down 0.25%. The session low sits at $61,207.
Price has been grinding lower after the earlier rejection. It tagged the $61,207 low and is now consolidating just above it.
The structure shows a series of lower highs and lower lows.

27
25
1,472


$NVDA DOWN 3.54%. BOUNCED FROM $150.12.
1H Binance chart.
Price is trading at $154.32, down 3.54%. 24h range is $150.12 – $161.55. Volume $1.71B, liquidations $3.36M, OI $401.30M, funding +0.0199%, L/S 0.96.
Price tagged a low near $150.12, then recovered. Current price is sitting above that low after the bounce.
The structure shows multiple FVGs left behind on the way down. Whether this holds above the recent low, or the prior high remains the ceiling, is the next read.

Charts are easy. Seeing the market isn’t.
CoinAnk puts the full derivatives picture in one place — positioning, liquidations, order flow, and the moves forming under the surface.
That’s what VIP is for.
Black Friday Coming Soon
coinank.com/

BTC NEAR THE MAX-STRENGTH ZONE. ONLY 0.47% AWAY.
3-day BTCUSDT liquidation heatmap.
Price has dropped into the lower range. Liquidation Radar shows 6 signals, 20/20 alerts active.
Strongest lower zone: $62,350 – $62,800, distance 0.47%, relative strength 100/100. Heat change +3.36%. Next is $62,150 – $62,250, distance 1.34%.
Closest upper zone: $65,600 – $65,650, distance 3.97%, relative strength 19/100. Next is $65,750 – $66,050, distance 4.21%, relative strength 77/100.
Peak intensity on the scale is 346.62M.

BTC ETF -$239.94M. ETH ETF -$29.09M. SPOT STILL FLOWING IN.
Spot ETF Net Flows on 11-17: BTC -$239.94M, ETH -$29.09M. Last 7 trading days: BTC -$1.30B, ETH -$436.25M.
24H spot inflows: $BTC +$117.88M, $ZIG +$22.87M, $MTX +$11.97M, $UMXM +$10.01M, $XRP +$9.47M, $NEAR +$7.40M.
Large liquidations are mixed. Biggest recent prints: $XRP short $150.65K, $XAU long $110.99K, $CL long $95.37K.
Hyperliquid whales remain heavy short. Combined short exposure across the top wallets sits above $580M on BTC and ETH, both profitable. One HYPE long is up +$49.60M.
News flash: liquidations in the last 4 hours, BTC up to the $65,000 mark, and earlier drop through $64,000.

You can't watch every contract.
Contract Radar flags CVD reversals, OI spikes, and extreme funding as they form — then ranks which ones actually matter.
VIP on CoinAnk
Black Friday is this Friday

25
26
1,394
BTC RECOVERED FROM $63,871. NOW AT $65,085.
Price is trading at $65,085, up 0.08%. 24h range is $63,871 – $65,679. Volume $11.66B, funding 0.0006%.
Price tagged a low near $63,871, then ran a sharp rebound into the $65,679 high before pulling back. Current price is consolidating just below that high after the bounce.
The structure shows a clean recovery from the session low.


$BTC AT $64,980
1-day BTC liquidation map
Current price is $64,980. Below it, a dense long liquidation cluster runs from roughly $63,000 to $64,500, with peaks near $1.8B. The cumulative long curve declines from around $2.0B to zero at the current price.
Above, short liquidations begin around $65,000 and stretch higher, with the thickest bars near $65,600 – $66,000 peaking around $1.5B. The cumulative short curve climbs toward $1.2B.

CoinAnk Fear & Greed Index
Current reading: 11 (Extreme Fear)
30 days ago the index sat at 64 — still in greed. Seven days ago it was 30. Today it’s 11, unchanged from yesterday.
The yearly high was 79 on September 22. In under two months, the same crowd went from celebrating to panic. We’re not at the year low of Extreme Fear-5 from February 7, but we’re close.
coinank.com/chart/indicator/…

GM
BTC ETF -$185.45M. 7-DAY OUTFLOWS DEEP.
Spot ETF Net Flows on 11-13: BTC -$185.45M. Last 7 trading days: BTC -$1.91B.
24H spot inflows: $MTX +$11.01M, $RWUSD +$7.60M, $MUB +$6.11M, $NVDAB +$4.90M, $SOXLB +$4.72M, $NEAR +$2.90M.
Large liquidations are mixed. Biggest recent prints: $BTC long $299.13K, $ETH short $292.45K, $BTC long $59.18K.
Hyperliquid whales are still heavy short. Combined short exposure across the top wallets sits above $580M on BTC and ETH, both profitable. One HYPE long is up +$49.60M.
News flash: liquidations in the last 4 hours, and BTC down through the $65,000 mark.

25
20
1,406
BTC AT $66,193 AFTER THE DROP. NOW SITTING NEAR THE LOW.
2H Hyperliquid chart.
Price is trading at $66,193, down 4.27%. 24h range is $66,077 – $69,470. Volume $3.56B, liquidations $140.64M, OI $2.51B, funding +0.0006%, L/S 0.92.
Price sold off hard and tagged a low near $66,072. Current price is sitting just above that low after the decline.
The structure shows multiple FVGs left behind on the way down.
coinank.com/proChart

BTC NEAR $69K. MAX-STRENGTH ZONE SITS 7.57% ABOVE.
3-day BTCUSDT liquidation heatmap.
Price dropped hard and is consolidating. Liquidation Radar shows 4 signals, 20/20 alerts active.
Strongest upper zone: $74,800 – $75,200, distance 7.57%, relative strength 100/100. Next is $76,100 – $76,500, distance 9.44%, relative strength 76/100. Closest upper layer: $72,300 – $72,600, distance 3.97%, relative strength 50/100.
Lower zone: $66,300, distance 4.65%, relative strength 6/100.
Peak intensity on the scale is 277.76M.
coinank.com/chart/derivative…

LONGS HEAVILY HIT.
Total liquidations: 1D $958.36M (longs $854.45M, shorts $103.91M). 12H $652.22M (longs $589.34M). 4H $101.90M (longs $77.95M). 1H $3.25M.
Heatmap is dominated by long-side prints. Largest: $BTC 1.26M, $AKE 541.46K, $ETH 384.54K, ethereum:0xf0db65d17e30a966c2ae6a21f6bba71cea6e9754 245.66K, $NVDA 152.77K.
Recent Binance prints: $BTCUSDT long $13.80M, $BTCUSD_PERP long $12.81M, $BTCUSDT long $11.87M.
In the past 24 hours, 138,213 traders were liquidated.
The long side is taking the damage.

31
27
1,704
BTC DOWN 6.45%. NOW AT $68,759.
1H Binance chart.
Price is trading at $68,759, down 6.45%. 24h range is $67,449 – $73,607. Volume $20.45B, liquidations $522.03M, OI $6.92B, funding +0.0015%, L/S 0.88.
Earlier high sat at $81,188. Price then sold off hard and tagged a low near $67,449. Current price is sitting just above that low after the decline.
The structure shows a clean breakdown through the mid-70k zone. Whether this holds above the recent low, or the prior high remains the ceiling, is the next read.
coinank.com/proChart

28
23
1,632