

Charted NFL analytics for analysts, bettors, and fantasy football players. 750+ data points per play. Research tools & detailed matchup reports. Only $200/year.
NFL Stats & Tools →
Joined April 2022
- Tweets8.6K
- Following45
- Followers58.5K
- Likes570





Pinned Tweet
Data Suite 2.0 is here!
An NFL Data package on par with what the NFL teams use, but 1/1,000th the price
We want to empower fans. We want to level up content creators. We want to start a new analytics revolution
New site ➡️ fantasypointsdata.com


Fantasy Points Data retweeted

Kyle Monangai
Monangai is fresh off a multi-week absence, but enters back into the fold in a spot where he could crush. For one, let’s not forget how good Monangai was running prior to injury, averaging 5.4 YPC and a league-leading RYOE/Att (1.55) and YACo/Att (3.25). While there’s a chance he’s a bit less effective due to his toe injury, I feel good about Monangai looking solid in this advantageous matchup.
Said matchup is prime for Monangai to both earn volume and keep up his efficiency. The Saints are 31st in EPA/Rush and 24th in YPC allowed, letting up the 4th most rushing yards per game to RBs on the year. On top of that, the Bears are very live to blow this struggling Saints team out of the water and therefore run the ball a ton, coming in as -11.5 favorites.
Schematically, the Saints have struggled against the Bears’ bread and butter, which is zone concepts (4th highest rate per @FantasyPtsData) and more specifically outside zone runs (easily leading the NFL in OZ attempts). The Saints are bottom 6 in YPC allowed to both zone/outside zone, and bottom 3 in success rate against both. Monangai has been elite on these outside zone runs, top 10 among all RBs in YPC and breakaway rush rate.
With fresh legs, I wouldn’t be at all surprised if Monangai steps into a 50/50 workload split or even leads the room. I don’t believe the Bears wanted to give Swift this much work based off their comments, and they tried to work Roschon in at times in Monangai’s absence, so it’d make sense to bump up Monangai’s workload down the stretch.
The Play: Over 44.5 rush yards, alt 70+ (+305) rush yards and 2+ TDs (+850), cheap low-owned DFS play
Fantasy Points Data retweeted
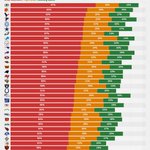
A breakdown of NFL QB ball placement from a clean pocket this season
🟢 Highly Accurate
🟡 Poor Placement, but Catchable
🔴 Inaccurate & Uncatchable
Data: @FantasyPtsData | min. 120 attempts | only throws with > 0 air yards


Fantasy Points Data retweeted

I have some updated Playoff Strength of Schedule Matchup Charts for each position (using @FantasyPtsData)
I also included a projected points-scored graphic for each playoff game based on advanced offensive and defensive metrics


Buffalo (-16.5 vs. MIA) and Kansas City (-16.5 vs. ARI) are both favored by 16.5+ this week.
This is only the third week over the last 25 years we've had multiple teams favored by so many points
Since 1999, 16.5+ point favorites win 94% of the time but are 25-27-2 against the spread
Fantasy Points Data retweeted
The Indianapolis Colts:
Weeks 1-10 in 2025 vs. Weeks 1-10 in 2026
@FantasyPtsData

Fantasy Points Data retweeted
Six NFL defenders have allowed a league-high 5 TDs in coverage this season:
DAL DaRon Bland
SF Deommodore Lenoir
GB Javon Bullard
CHI Tyrique Stevenson
WAS Mike Sainristil
ARI Budda Baker
@FantasyPtsData
Josh Allen vs. Miami, regular season:
13-3 record
26.3 fantasy points per game
42 passing TDs in 16 games
This year, Miami allows the 5th-most EPA per dropback and the 2nd-highest CPOE. Buffalo is a 16.5-point favorite on Sunday.
@FantasyPtsData

7
4,820
Fantasy Points Data retweeted
The NFL's negative air yards enthusiasts
1. Patrick Mahomes 25%
2. Justin Herbert
29. CJ Stroud
30. Jayden Daniels
Data: @FantasyPtsData | min. 150 attempts

Fantasy Points Data retweeted
Passer Rating Allowed when Targeted
Data: @FantasyPtsData | min. 30 targets

Fantasy Points Data retweeted

Joe Burrow is doing MVP things, and then there is Daniel Jones. Cheers to not having to watch him play another game this season 🍻
@FantasyPtsData

Fantasy Points Data retweeted
Accuracy Under Pressure
1. Joe Burrow
2. Drake Maye
3. Caleb Williams
...
And all the way at the bottom: Michael Penix
Data: @FantasyPtsData

Fantasy Points Data retweeted
QB Supporting Cast Ranking since Week 5
1. DET
2. NYJ (Geno Smith has some explaining to do)
3. SF
...
30. MIA
31. LAC
32. PHI
Metrics from @FantasyPtsData

Fantasy Points Data retweeted
When the pressure is on, who's still going deep?
Josh Allen at an absurd 30%. #ethical
Data: @FantasyPtsData | 20+ Yard Throws

Emeka Egbuka [2026]
w/ Jalon Daniels
+ 30.5% target share
+ 4.7 XFP/G
w/ Baker Mayfield
+ 19.1% target share
+ 8.9 XFP/G
@FantasyPtsData

Todd Bowles says Baker Mayfield looked good in practice today and is trending in the right direction to start on Sunday.
3
25
6,804
Fantasy Points Data retweeted
The NFL's best in coverage 🔒
30 defenders ranked by lowest total EPA allowed when targeted.
Data: @FantasyPtsData


Fantasy Points Data retweeted
QB Performance vs. Man & Zone Coverage
Data: @FantasyPtsData | min. 100 dropbacks

Fantasy Points Data retweeted
I've become a little bit obsessed with route and target data charted as "open" for WRs (thanks @FantasyPtsData)
And I wanted to take a look at receivers who performed well on targets where they were not "open"
Then compare it to receivers that are getting open, and are probably not being targeted as much as they should be based on their EPA/Target
1. This shows that there is a real argument to be made that Tee Higgins should be targeted even more often than he already is (he's been an absolute DAWG this season)
2. Every single data point we have points toward the fact that Christian Watson should be seeing more targets in the Packers offense
3. I already consider this a "breakout" year for Ryan Flournoy, but I am very curious what his ceiling could be if the Cowboys move on from George Pickens
4. I really think we see Rome Odunze performs as a top-20 WR rest of season, with the assumption Caleb Williams airs it out more and Odunze stops dropping easy TDs
5. Tyler Shough really should not be struggling as much as he has been lately with the WR corps he has (could be an OL issue)


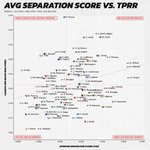
How often are WRs targeted when they are charted as "open" on a route?
Which WRs are getting "open" on their routes more often than not?
And which WRs might not be getting targeted as often as they deserve?
This chart answers each question using @FantasyPtsData!

