

"Foresee the Data. Index the move." On-chain evidence over hype @ForeDex_Proof Founder @mignoletkr TG : https://nitter.cf/t.co/0qFY3C9ByC
Global
Joined April 2026
- Tweets2.6K
- Following166
- Followers1.9K
- Likes2K



Pinned Tweet
🤝@ForeDex_Global has officially signed an MOU with the Blockchain Research Institute at Hansung University!
Through this partnership, we'll work together on research and technical collaboration to improve the accuracy and reliability of on-chain data.
🔍 In particular, we'll focus on on-chain address labeling, developing better ways to identify and classify blockchain transactions and wallet addresses.
We'll also cross-validate our datasets to improve analytical accuracy and overall data quality.
🚀 ForeDex is still an early-stage startup, but we're steadily growing and strengthening our technology and data capabilities.
We hope you'll continue to follow our journey!
Our goal is to become a trusted on-chain data provider that more people can confidently rely on.
Thank you for your continued support! 🙏
digitalasset.works/news/arti…

🎙️ GIWA TALK is starting soon! See you there! 👋

기와 토크 2회, 1시간 뒤 시작합니다 🎙
FLOW on GIWA
기와로 흘러올 돈, 어디로 흐르고 어디에 머물까?
📅 오늘 밤 9시
📍 nitter.cf/i/spaces/1yboYdEYaQzer…
사전 질문 당첨자도 라이브에서 현장 인증을 한 분 중에서 선정합니다. 스페이스 알림을 설정해 두세요!

📉 The sharp decline in STRC preferred shares was accompanied by significant selling volume.
🐋 This suggests that a large market participant may have aggressively sold a substantial position within a short period of time, rather than this being just a routine price correction.
⚠️ This could be a sign of tightening market liquidity.

#Bitcoin’s rebound may still belong to a bottoming phase. @ForeDex_Global Recognized Analyst @Scofield_2025 examines the projected path:
👨🏫 #Bitcoin’s bear market is not over, with the final bottoming phase likely extending into early 2027. A weekly close below the '200-Week Moving Average' recalls the prolonged bottoming process that followed a similar breakdown in 2022. With the Fed’s rate-hiking cycle still underway, an immediate bullish reversal remains unlikely.
📉 Under a neutral scenario, the expected bottom is $54K–$60K, supported by the 0.786 Fibonacci retracement near $57K and the lower boundary of the 2024 consolidation range around $54K. A more severe downside scenario could extend toward $40K. 🧐
📉 #Bitcoin may rebound toward the '200WMA' this week before entering a period of consolidation to establish a bottom. However, a sustained bullish reversal would require renewed liquidity or a decisive shift in expectations for further Fed rate hikes.
foredex.io/charts/cycle/200-…


历史总是惊人的相似,接下来我要说一段暴论。:
“熊市没完,我们正在进入本轮周期最后的筑底阶段。”
7月27日,我为本轮牛市推演了2个周期反转的时间点,一个在今年8月,一个在27年1月(图1)。 当时,我更偏向于后者。
8月的大涨让我一度怀疑,熊市是否按照剧本1已经走完了。现在看来,我们仍然在剧本2,8月突破回踩之后,需要一个更加确定的信号来完成周期反转,大概率会在27年1月。
肯定有人要说,怎么涨了就喊牛,跌了就喊熊?
首先,我从8月大涨到现在从来没说过牛市已经来了(唱反调倒是不少,讨人嫌)。
其次,你不好奇这个阶段理论上的底部在哪吗?
话不多说,正式进入分析:
除了近期稳定币与ETF的颓势,本周让我高度怀疑要再次筑底的信号有3个:
1. 第一次确认跌破200周线(图2):是的,你没看错,本周大概率将是此次周期,第一次周线确认跌破SMA200。而上轮周期正是在跌破之后才开始了漫漫筑底长路。
2. 时间上惊人的巧合(图2):22年11月FTX破产,一根大阴线,把价格直接砸进了年底盘整期;26年11月老黄离任,又是一根大阴线。有意思的是,同样级别的大阴线,也都发生在22年和26年的6月,让人不禁怀疑,这次是否也会像22年底一样,进入休赛期呢?
3. 加息周期(图3):22年的持续下跌,还与当年3月开始的加息密不可分,不像今年25bp加完还得犹豫半天,彼时加息都是50-75BP的猛加。而真正的反转发生在加息末期,也就是加息开始减速,从23年1月开始变为25bp,市场才逐渐回暖。BTC也是彼时吹响了牛市的号角,一路向上。来到26年,9月完成了第一次加息,下一次可能是12月,27年还有。所以,要说现在是加息末期,实在有点勉强。要反攻,从利率路径上来看,还缺乏一定支持。
在这3个信号叠加的情况下,我目前更偏向BTC接下来会匍匐一段时间,蓄势待发,而不是立马反攻。
那么这个底会在哪呢?
@mignoletkr 在今天分享的分析里提到,最坏情况下,很有可能会到40K。
而我认为在一个更加中性条件下,这个底最终会是:
54-60K
理由如下(图4):
1. 斐波拉切:如果用20年的底部和周期高点拉一条斐波拉切,那上轮熊末的底部就在0.786这个位置。同样,本轮周期已经在0.786(57K附近)反复试探,始终没有跌破,说明这个位置确实有比较强的底部共识。
2. 24年整理区间的底部:本轮周期和上轮不太一样的地方在于,24年几乎一整年都在同一个箱体内整理,而这个箱体的下沿,就在54K,是AMD中A的筹码底价。
3. 11月这根阴线的底部:如果历史会重演(我知道有点玄学),那11月的这根大阴线就是最后一跌了。接下来的盘整不会有更大的向下动力,而是逐渐形成一个底部平台。
综上所述,我目前的预测是,BTC将继续按照剧本2发展,本周反扑,触达200周线后,进入盘整,底部在54-60K。待流动性回归或加息预期出现明显转向时启动牛初,最近的窗口大概率会在27年1月。
Data from @ForeDex_Global & TradingView


4
583
⚠️ Reversal signals meet persistent market risk. @ForeDex_Global Recognized Analyst @0xGummyBear explains what the reading captures during market weakness:
🧸 Short positions opened after #Bitcoin broke below the 'Short-Term Holder Realized Price (STH-RP)' remain in place. Although some indicators suggest oversold conditions or a potential reversal, broader market risks have not eased, particularly pressure on the AI trade in U.S. stocks.
For investors continuing to hold $BTC, the focus remains on 'STH-RP' and the 'Adjusted Unrealized Profit Stress Ratio (AUPSR)'. The ETF-excluded AUPSR measures unrealized profit and loss pressure across holders and fell to about 57.3% over the weekend, still above this bear market’s low of 54.2%.
Lower price levels remain possible, especially with short-term moves vulnerable to unexpected events and shifts in sentiment. U.S. equities need to stabilize before a broader recovery across other asset classes can take shape. 🙏
foredex.io/charts/on-chain/b…


今天来回顾一下上周的操作盘点。
🟣当初担心会重回熊市,在价格跌破STH-RP后就开了空单的朋友:
目前建议还是可以先继续拿着。虽然部分指标已经开始出现超卖或反转信号,但整体的市场风险——尤其是美股AI主线的压力看来还没消除。所以这张为了保护仓位而开的空单,暂时还是有继续持有的理由。
🟣而对于选择“死守”的朋友来说:
现在无疑还是极度痛苦的时期。但就像我们上周提到的,除了STH-RP价格支撑线外,也可以留意一下AUPSR有没有跌破这轮熊市的低点。
目前这个值在周末最低来到57.3%附近,起码还高于这轮熊市低点的54.2%。
但大家还是要留心,这并不代表价格就不会再次下探测试了。
AUPSR主要是用来衡量剔除ETF干扰后,整体筹码的盈亏承受压力;短期的价格表现还是很轻易会被突发事件或市场情绪给影响。
大家先多留意一下美股行情的走势吧!毕竟主线要先走稳了,其他资产类别也才有发挥空间。
数据来源:@ForeDex_Global

3
343
Daily ForeDex CVD by Order Size (Spot) Snapshot 📸
🔸 Whales and Mega Whales Only
🔸 Based on a 1 month period (1M)
1. Binance: No Change ➖
2. Bybit: No Change ➖
3. Bitfinex (USD): No Change ➖
4. Bitfinex (USDT): No Change ➖
✅ Summary: No changes in whale CVD across all four exchanges today.
[11-18-2026]
foredex.io/charts/spot/cvd?r…


6
425
🚀 Our newly released "DeFi Lending Liquidity", along with "Exchange Whale Flow Indicator" and "Global BTC/Altcoin Correlation Heatmap", played an important role in analyzing market conditions during the recent sharp price movements.
📊 These indicators will continue to be valuable tools for identifying key market signals and understanding changes in market dynamics.
🔍 ForeDex, we are continuously developing new datasets that go beyond simple price movements to provide deeper insights into market participants' liquidity flows and investor sentiment.
🐳 Stay tuned for more innovative datasets and market insights from ForeDex!


🏰 Former support now stands as resistance. @ForeDex_Global Recognized Analyst @KaanChart examines the break of the '200-Week Moving Average':
👨💼 #Bitcoin closed the week near $64.8K, roughly 5% below its '200-Week Moving Average' at $68K. After holding declines in June and July, that level has now shifted from support to resistance.
📉 'STH-NUPL' fell to −0.18 on November 14 before recovering slightly to −0.14, still well above February’s −0.46 low. Spot ETFs saw seven straight days of outflows totaling $1.67B, followed by just $8M in inflows on November 16 and no net flow afterward. Institutional selling has paused, but demand remains weak, while 'Fear & Greed Index' has reached 10(Fear).
📉 The outlook stays bearish below $68K, with any rebound toward that level viewed as a resistance test rather than a reversal. A pause in ETF outflows amid extreme fear could allow a short-term bounce, while the $53.6K realized price remains the next major support and a potential DCA area if weakness persists.💎🙌
foredex.io/charts/cycle/200-…


bitcoin:native | سقط الدعم الذي حذرنا منه… ماذا بعد؟ 👇
الأسبوع الماضي قلنا إن الإغلاق الأسبوعي تحت المتوسط المتحرك لـ200 أسبوع يفتح الطريق لضغط أعمق. أغلق Bitcoin الأسبوع عند قرابة 64.8K$، تحت المتوسط (68K$) بنحو 5%.
📉 200 أسبوع: الخط الذي صد الهبوط في يونيو ويوليو كُسر هذه المرة بإغلاق أسبوعي واضح. ما كان دعماً، صار الآن مقاومة عند 68K$.
STH-NUPL:-
خسائر المضاربين قصيري الأجل تعمّقت إلى −0.18 في 14 نوفمبر، بعد أن كانت قرب الصفر قبل أسبوعين. ثم تحسنت قليلاً إلى −0.14. لكنها ما زالت بعيدة عن قاع فبراير (−0.46).
ETF:-
بعد 7 أيام خروج متتالية بنحو 1.67B$، سجّلت الصناديق دخولاً صغيراً بـ 8M$ في 16 نوفمبر، ثم صفراً اليوم. البيع المؤسسي توقف، لكن الشراء لم يبدأ بعد.
الدعم التالي:-
السعر المحقق (Realized Price)، أي متوسط تكلفة كل البيتكوين في السوق، يقع عند 53.6K$. تاريخياً هو آخر خط دفاع في الأسواق الهابطة.
- الخوف والطمع عند 10، خوف شديد.
رؤيتيلكل هذا:-
الاتجاه هابط ما دام السعر تحت 68K$، ولا افضل الشراء قبل استعادته بإغلاق أسبوعي.
لكن توقف خروج ETF مع خوف شديد قد يمنحنا ارتداداً قصيراً.
أي صعود نحو 68K$ أعتبره اختباراً للمقاومة، وليس انعكاساً.
وإذا استمر الضعف، فمنطقة 53.6K$ هي الهدف الذي أراقبه للشرراء DCA
📊 Data via @ForeDex_Global
#BTC #Bitcoin


4
472
Daily ForeDex CVD by Order Size (Spot) Snapshot 📸
🔸 Whales and Mega Whales Only
🔸 Based on a 1 month period (1M)
1. Binance: Increased 📈
2. Bybit: No Change ➖
3. Bitfinex (USD): No Change ➖
4. Bitfinex (USDT): No Change ➖
✅ Summary: Binance continued its gradual CVD recovery with another modest increase, while Bybit and both Bitfinex pairs showed no change.
[11-17-2026]
foredex.io/charts/spot/cvd?r…


341
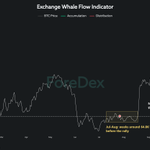
🐳" Exchange Whale Flow Indicator" has shown no meaningful signs of accumulation since 2023.
📉 Furthermore, the whale distribution pattern observed before this latest decline was remarkably similar to the pattern we saw in January of this year.
🔍 Keep tracking the detailed activity of individual whales, rather than relying solely on simple exchange inflow and outflow data.

#Bitcoin is back at a familiar price zone. @ForeDex_Global Recognized Analyst @Satoureireal revisits the February lows and summer range:
⭐️ ForeDex’s 'Exchange Whale Flow Indicator' signaled distribution near $75K on November 9, before Bitcoin fell roughly $10K to $64.8K over the following week. Attention now shifts to whether $64.8K can hold as support. 🏋️
⭐️ This level aligns with February’s low and the July-August trading range, where $BTC consolidated for weeks before rallying toward $80K. Holding this support would suggest the recent decline has run its course, while a decisive break below would indicate further selling pressure.
foredex.io/charts/exchange-f…


$BTC's latest whale flag printed near 75K. The reaction is already on the chart
ForeDex's Exchange Whale Flow Indicator marked a distribution point around Nov 9, with BTC near 75K USD. The indicator tags whale exchange flows as distribution (red) or accumulation (green).
In the week since, price moved down about 10K USD to 64.8K USD. So the flag is no longer an early warning. It describes a move that has already happened.
Where price landed matters more now. The 64.8K USD line runs through the Feb low area and the Jul-Aug range, a zone where BTC spent weeks before rallying toward 80K USD in late Aug.
Holding this zone would leave the Nov 9 flag as the start of a leg that is done. A clean break below would say the selling was not finished.
Source: @ForeDex_Global, Exchange Whale Flow Indicator, Nov 16, 2026
#Bitcoin #BTC #OnChain

1
3
640
🔀 Same #Bitcoin price, different outcomes. @ForeDex_Global Recognized Analyst @BaykusCharts looks at what realized profit ratios can tell us:
⚖️ Long-term and short-term #Bitcoin holders are selling at similar prices but with different outcomes. Long-term holders’ realized profit ratio is 1.05, indicating an average 5% gain, while short-term holders’ ratio is 0.98, reflecting a 2% loss.
🔎 The modest long-term gains partly reflect the 155-day classification threshold, as $BTC bought around $60K-$63K in June now qualifies as long-term supply. Meanwhile, recent buyers from September and October near $75K-$87K are selling at losses around $66K.
🔎 Unlike previous market peaks marked by substantial long-term profit-taking, current selling pressure appears concentrated among newer holders near or below cost.
🦅 Periods like these usually end with seller exhaustion, but the ratio alone does not say when.
foredex.io/charts/on-chain/b…


Bugün borsada aynı fiyattan satış yapan iki farklı yatırımcı var. Biri az da olsa kârla çıkıyor, diğeri zararla.
İlki uzun vadeli yatırımcı. Harcanan çıktı kâr oranı, yani satılan coinlerin satış fiyatının alış fiyatına oranı, bu grupta 1,05 seviyesinde. Ortalama olarak %5 kârla satıyorlar. Bu, uzun vadeli yatırımcılar için oldukça düşük bir rakam. Mart 2024'te bu grup coinlerini maliyetinin onlarca katına satıyordu; geçen yazın zirvelerinde de 20 katın üzerinde satışlar görülmüştü.
Bu kadar düşük bir oranın bir açıklaması var. Uzun vadeli sayılmak için 155 gün yeterli. Haziranda 60-63 bin dolardan alınan coinler, kasım itibarıyla tam bu eşiği geçiyor. Bugün satış yapan "eski" yatırımcıların bir kısmı, aslında yazın dipten alıp beş ay bekleyenler olabilir. 66 bin dolardan satınca kârları da tam %5 civarına denk geliyor.
İkinci satıcı kısa vadeli yatırımcı. Bu grubun oranı 0,98. Ortalamada %2 zararla satıyorlar. Eylül ve ekimde 75-87 bin dolardan alanlar, fiyat 66 bine inince pozisyonlarını zararına kapatıyor. Bu yıl bu oran zaten çoğunlukla 1'in altındaydı; yalnızca eylüldeki yükselişte kısa süreliğine üstüne çıktı.
Yatırımcı açısından iki oran birlikte okununca tablo netleşiyor. Satış baskısı büyük kârlarını realize eden sabırlı ellerden değil, maliyetine yakın ya da zararda olan yeni ellerden geliyor. Böyle dönemler genellikle satıcıların yorulmasıyla sonuçlanır; ama ne zaman yorulacaklarını oran tek başına söylemez.
İki satıcı, aynı fiyat, iki ayrı hikâye.
Kaynak :@ForeDex_Global

5
549
What’s Missing From the $BTC Bounce? @ForeDex_Global Recognized Analyst @richnavi_b compares futures buying with past reversals:
👨🏫 #Bitcoin briefly broke below the key $63K order block, where strong buying first emerged during the August-September rally. However, the weekly candle closed back above this support, making consolidation between $63K and $66K–$68K more likely this week than an immediate further decline.
📉 The broader outlook remains bearish. Despite substantial long liquidations and a full retracement of the August–September rally, futures buying volume across exchanges remains weak compared with previous trend reversals, with no structural breakout in buying activity.
📉 Without sufficient buy-side liquidity to absorb selling pressure and support a sustained reversal, another low remains likely after short-term consolidation. ⚠️
foredex.io/charts/derivative…


* 수정 사항 및 하락이 끝났다고 보지 않는 이유
비트코인이 어제 일시적으로 이탈했던 63K 부근은 8-9월 상승 당시,
세력들의 강력한 매수 주문이 최초로 집행되었다고 볼 수 있는 OB(Order Block)이었습니다. (강한 양봉 직전 발생한 마지막 음봉 캔들)
그리고 직전 고점인 5월에 방문한 83K까지 강하게 돌파하며 숏 포지션 유동성을 대규모로 정리하고 내려왔다는 점에서,
63K 부근의 OB는 기술적 관점에서 매우 중요한 지지 역할을 합니다.
어제 급락 당시, 주봉이 일시적으로 OB를 이탈하며 하락에 추가적인 가속이 붙을 수 있었지만,
종가 마감 기준 꼬리를 만들며 지켜냈기 때문에
단기적으로 이번주는 가격이 추가로 하락할 가능성보다,
지지 구간인 63K 위와 저항 구간인 66-68K 아래에서 횡보 흐름을 만들 가능성이 높다고 생각합니다.
다만, 여전히 수급 상황을 보면, 추세 관점에서 반등이 길게 이어지는 것보다 하락(매도) 우위 구간으로 보는 것이 적합하다고 생각합니다.
이번 하락으로 8-9월 상승을 모두 되돌리며 롱 포지션 청산량이 상당한 수준으로 발생한 것은 맞지만,
문제는 이렇게 롱 포지션 유동성이 크게 정리되면서 가격을 상승 방향으로 전환시킬 매수세가 반응해야 하는데,
[사진 2]를 보면, 이에 대한 전체 거래소의 선물 매수 볼륨 자체는 이전 하락 → 상승 변곡 구간들에 비해 여전히 부족한 모습이며,
이전 변곡 구간들과 달리 볼륨의 구조 돌파를 만들지 못하고 있습니다. (파란색 박스)
결론적으로 매도를 위한 물량은 많은데, 이것을 받아줄, 그리고 중장기 상승 추세로 전환시킬 매수 측면의 유동성이 가격이 큰 폭으로 하락했음에도 반응하지 못하고 있기 때문에
단기 횡보 이후 저점을 갱신할 가능성이 높다고 생각합니다.
@ForeDex_Global


1
3
640
Daily ForeDex CVD by Order Size (Spot) Snapshot 📸
🔸 Whales and Mega Whales Only
🔸 Based on a 1 month period (1M)
1. Binance: Increased 📈
2. Bybit: No Change ➖
3. Bitfinex (USD): No Change ➖
4. Bitfinex (USDT): No Change ➖
✅ Summary: Binance whale CVD edged slightly higher following yesterday’s sharp rebound, while Bybit and both Bitfinex pairs remained unchanged.
[11-16-2026]
foredex.io/charts/spot/cvd?r…


3
422
😮 This is surprising.
Unlike the Crypto Fear & Greed Index, the Crypto YouTube Narrative Index is still in neutral territory.
📊 This reveals a clear divergence between the widespread fear across the broader crypto market and the sentiment reflected in crypto YouTube content.
🤔 Could this suggest that crypto YouTubers and market analysts still largely believe the current price levels represent a market bottom, without seriously considering the possibility of further downside?


Could U.S. interest be picking up? @ForeDex_Global Recognized Analyst @lukasz_wydra examines the Coinbase Premium move during #Bitcoin’s decline:
✨Despite #Bitcoin’s continued decline, the 'Coinbase-Binance Spot Gap' has steadily recovered from deeply negative readings toward zero over the past few days, suggesting improving U.S. spot demand.
✨ The latest 24-hour reading remains negative at -$31.21, but the narrowing discount raises the possibility of renewed buying interest from U.S. investors, including institutions. 🤩
foredex.io/charts/market/spo…


Bitcoin (BTC) Update 📊
🔹 An interesting observation that may deserve a closer look. Despite Bitcoin's ongoing decline, Coinbase Premium has been behaving in a rather unexpected way. Take a look at what's happening: its negative readings have been steadily moving closer to zero over the past few days.
Could this indicate growing interest from US investors, including institutional players? The latest 24-hour reading stands at -$31.21.
@ForeDex_Global

4
727
ForeDex retweeted

"Why Am I Focusing on More Granular Liquidity Data Instead of Traditional On-Chain Indicators?"
Those who have been following my analysis closely since last year will already know this.
I still actively use on-chain data. However, I rarely rely on indicators that broadly aggregate activity across the entire Bitcoin network anymore.
Instead, I break down market participants into more specific categories, quantify capital flows at the level of individual companies and institutions, and develop datasets that I can directly incorporate into my analysis.
@ForeDex_Global continues to develop new datasets based on this same analytical philosophy.
Some examples include:
- OTC Data
- Market Maker Data
- Institutional Custody
- DeFi Lending Liquidity
These datasets are designed to track specific market participants and activities directly involved in providing or utilizing liquidity.
In particular, DeFi Lending Liquidity allows us to analyze not only capital inflows but also the accumulation of leverage-driven liquidity and signs of overheating in market sentiment.
This dataset has been particularly helpful in navigating the current market, and I believe it could continue to play an important role in the future.
So why do I insist on breaking down on-chain data into such granular categories?
Because the Framework for Interpreting Traditional On-Chain Data Has Changed Since the Approval of Bitcoin ETFs.
Since the approval of spot Bitcoin ETFs, the market's trading structure and the way capital moves have changed significantly.
As a result, I believe traditional on-chain indicators now contain considerably more noise and structural distortion.
The problem is that many analysts continue applying historical interpretation frameworks without sufficiently accounting for these structural changes.
I am not suggesting that on-chain data has lost its value.
Quite the opposite. I firmly believe on-chain data remains extremely valuable.
However, when market structure changes, the framework we use to interpret the data must evolve as well.
Let me walk through a few examples.
1. "Active Addresses"
During previous Bitcoin bull cycles, increases in active addresses generally moved in the same direction as Bitcoin's price.
However, that relationship has changed significantly during the current cycle.
Bitcoin's price has risen, but active addresses have failed to show the same level of growth seen in previous cycles.
Why is this happening?
I believe one of the major reasons is the structural change in trading activity following the approval of spot Bitcoin ETFs.
In the past, whales directly bought and transferred Bitcoin, generating on-chain transactions in the process.
Today, however, many institutions and investors gain Bitcoin exposure through ETFs, while ETF-related institutions handle the underlying Bitcoin custody, settlement, and related operations.
To illustrate this with an extreme example, trading activity that previously required 100 separate on-chain transactions might now be processed through a single transaction under a different market structure.
Of course, this is simply a hypothetical example intended to explain the structural change.
Now imagine this trading structure continuing for another three to five years.
Think seriously about how much it could change not only active addresses but also many other on-chain indicators.
2. "Segmented MVRV Ratio"
Now look at the Segmented MVRV Ratio, calculated specifically for ETF-related entities.
Its behavior is completely different from what we've historically observed in traditional MVRV indicators.
In particular, the ratio has struggled to rise significantly above the 1.0 level.
One possible explanation is that ETF-related entities operate under different custody and trading structures compared to traditional Bitcoin investors.
If ETFs continue to play a major role in the market, the MVRV of ETF-related entities may continue to behave within a different range from the historical MVRV of the broader Bitcoin market.
Now consider this
If even MVRV, one of the most widely used on-chain indicators for years, is behaving differently from its historical patterns, can we really assume that other indicators remain unaffected?
3. "Bitcoin Exchange Whale Inflow"
Next, let's examine exchange inflows specifically attributed to whale entities.
In previous cycles, severe market conditions sometimes produced whale inflows exceeding 10,000 BTC in a single day.
Large inflows of around 5,000 BTC were also frequently observed.
Today, however, even when similarly large transfers appear, many turn out to be internal wallet movements.
Does that mean whales have disappeared from the market?
No. It means the way whales conduct transactions has changed.
Compared to the past, whales increasingly utilize market makers and institutional trading infrastructure. They may also split large transfers into multiple smaller transactions.
For example, instead of depositing 3,000 BTC in a single transaction, a whale might now deposit 300 BTC across ten separate transactions.
Under these circumstances, traditional thresholds for identifying large whale deposits may fail to capture actual selling activity effectively.
The whales haven't necessarily disappeared. Rather, the traditional methods used to track them may no longer adequately reflect how the market operates.
4. "Addresses with Balance"
Finally, let's examine Bitcoin addresses categorized by their holdings.
In the chart
- Orange line: Addresses holding at least 1,000 BTC
- Blue line: Addresses holding at least 100 BTC
During the bull and bear market cycles between 2020 and 2023, accumulation and distribution among addresses holding at least 1,000 BTC were closely associated with major market movements.
However, the current cycle looks significantly different.
The number of addresses holding at least 1,000 BTC has remained relatively flat or even declined, while the number of addresses holding at least 100 BTC has increased sharply.
Why are we seeing such a divergence?
I believe changes in institutional Bitcoin custody and trading practices following ETF approval may have played an important role.
But here's the key point
An increase in addresses holding at least 100 BTC does not automatically prove that genuine accumulation is taking place.
An increase in address count does not necessarily represent new investors entering the market or additional net buying.
Address counts can also change because of the redistribution of existing holdings, changes in custody structures, or internal wallet reorganizations.
So let me ask you something.
If genuine large-scale accumulation is taking place, how should we interpret a situation where addresses holding at least 1,000 BTC remain stagnant while addresses holding at least 100 BTC surge?
Simply pointing to the increase in 100 BTC addresses and declaring that accumulation is underway is not sufficient analysis.
It may amount to selectively choosing data that supports a conclusion you've already decided on.
Ultimately, What Matters Is Not Just the Data, but the Framework Used to Interpret It.
The message I want to convey through these four examples is straightforward.
The structure of the Bitcoin market has changed since ETF approval, and the framework for interpreting traditional, broadly aggregated on-chain indicators must change accordingly.
Indicators that were useful in previous cycles may now contain significantly more noise and structural distortion.
But how many people truly understand these changes well enough to establish new analytical standards?
And beyond the four examples I've discussed, can we really assume that other on-chain indicators are free from similar structural distortions?
During the 2025 bull market, did traditional on-chain indicators identify the market top as effectively as they had in previous cycles?
I believe this is a question worth considering seriously.
Again, I'm not saying traditional on-chain indicators have become completely useless.
However, if we continue applying historical interpretation frameworks without properly understanding the structural distortions embedded in the data, the accuracy of our investment decisions may actually deteriorate.
Until these distortions are better understood and more reliable interpretation frameworks emerge through subsequent market cycles, I don't intend to rely heavily on traditional, broadly aggregated on-chain indicators.
This is precisely why, since last year, I've shifted my focus away from simply aggregating market-wide data and toward identifying and analyzing the specific participants that actually drive liquidity flows.


Looking at "CeFi and DeFi Leverage Liquidity" on a weekly basis, the underlying liquidity trends become much clearer.
These represent aggressive capital flows driven by leverage.
However, historically, market conditions have not tended to develop favorably following periods of aggressive inflows of this kind.
📊 CeFi Leverage Liquidity has reached its highest weekly level since December 2021.
📊 DeFi Leverage Liquidity has also reached its highest weekly level since late July of last year.
Even if the market manages to absorb the impact of these liquidity flows, unwinding excessive leverage and allowing the market to cool down could take considerably longer than expected.
@ForeDex_Global


Daily ForeDex CVD by Order Size (Spot) Snapshot 📸
🔸 Whales and Mega Whales Only
🔸 Based on a 1 month period (1M)
1. Binance: Increased 📈
2. Bybit: No Change ➖
3. Bitfinex (USD): No Change ➖
4. Bitfinex (USDT): No Change ➖
✅ Summary: After several days of decline, Binance whale CVD saw a notable rebound. Bybit and both Bitfinex pairs remained unchanged.
[11-15-2026]
foredex.io/charts/spot/cvd?r…


3
469
Daily ForeDex CVD by Order Size (Spot) Snapshot 📸
🔸 Whales and Mega Whales Only
🔸 Based on a 1 month period (1M)
1. Binance: Decreased 📉
2. Bybit: No Change ➖
3. Bitfinex (USD): No Change ➖
4. Bitfinex (USDT): No Change ➖
✅ Summary: Whale CVD continued to ease slightly lower on Binance, while Bybit and both Bitfinex pairs remained unchanged from yesterday.
[11-14-2026]
foredex.io/charts/spot/cvd?r…


🐳 Whale deposits surged as #Bitcoin fell. @ForeDex_Global Recognized Analyst @KaanChart compares the exchange inflows with their usual pace:
$BTC fell nearly 14% from $78.8K to $67.4K before rebounding to $69.2K. 'Bitcoin Exchange Whale Inflow' surged to 23.9K $BTC on November 9–12, including nearly 13K on November 11 versus a usual 1.5K daily, while six consecutive days of ETF outflows(since November 5) added up to $1.49B.
🎢 'STH-SOPR' fell to a monthly low of 0.9775, reflecting realized losses among short-term holders. The sell-off triggered $1.84B in liquidations within 24 hours, while 'Fear & Greed' fell to 20.
⚠️ $BTC briefly lost the 200-week moving average at $67.8K, a support level that held in June and July, before reclaiming it. The bounce is encouraging but insufficient with whale selling persistent and institutional demand absent. A weekly close above $67.8K, combined with reduced whale inflows and renewed ETF buying, would confirm a bottom; a close below would expose $BTC to deeper selling.
foredex.io/charts/exchange-f…


bitcoin:native | هبوط 67.4K$
لنرى المؤشرات ونشرح ما حدث وأين يقف الدعم الآن 👇
تراجع Bitcoin من قرابة 78.8K$ في 5 إلى 67.4K$ اليوم، بخسارة تقارب 14% خلال أسبوع، قبل أن يرتد إلى 69.2K$.
🐋 نرى الحيتان باعت:-
نحو 23.9K BTC دخلت البورصات من الحيتان بين 9 و12 نوفمبر، منها قرابة 13K BTC في يوم واحد (11 نوفمبر). هذا أكبر دخول منذ أسابيع، والمتوسط المعتاد يقارب 1.5K BTC يومياً.
🏛️ والمؤسسات غابت:-
صناديق ETF سجّلت 6 أيام خروج متتالية، بنحو 1.49B$ منذ 5 نوفمبر. لا مشتري كبير يمتص المعروض.
المضاربون استسلموا:-
مؤشر STH-SOPR نزل إلى 0.9775، وهو أدنى مستوى خلال الشهر. المضاربون قصيرو الأجل يبيعون الآن بخسارة واضحة، ومعه تصفيات بنحو 1.84B$ خلال 24 ساعة، ومؤشر الخوف والطمع عند 20.
📉 واختبار الدعم:-
من المتوسط المتحرك لـ200 أسبوع نراه عند 67.8K$.
والسعر كسره لساعات ونزل إلى 67.4K$، ثم عاد فوقه سريعاً.
هذا الخط صد الهبوط في يونيو ويوليو هذا العام، ويبدو أنه يختبره مرة أخرى الآن.
من وجهة نضرب لصفقاتي الارتداد من 67.4K$ إشارة إيجابية أولى، لكنه وحده لا يكفي، فالحيتان ما زالت تبيع والمؤسسات غائبة فلن اطارد الارتداد.
اذا كان الإغلاق الأسبوعي فوق 67.8K$، مع تراجع دخول الحيتان وعودة ETF للإيجابي، سيؤكد أن القاع تشكّل.
اما اذا كان الاغلاق الأسبوعي تحته فيعني أن الدعم الأقوى في الدورة سقط ويفتح الطريق لضغط أعمق.
📊 Data via @ForeDex_Global
#BTC #Bitcoin


1
9
798
📉 #Bitcoin breaks a key holder cost level. @ForeDex_Global Recognized Analyst @0xGummyBear examines the breakdown:
🧸 #Bitcoin has broken below the 'Short-Term Holder Realized Price (STH-RP)' and entered the $60K range, leaving the market in a period of uncertainty. With panic still widespread, short positions opened as protection can remain in place until sentiment improves or $BTC firmly reclaims 'STH-RP'.
🟣 For long-term holders, the 'Adjusted Unrealized Profit Stress Ratio (AUPSR)', which excludes ETF holdings, offers another reference. Historically, pullbacks during bull markets have generally remained above the AUPSR lows established at previous bear-market bottoms.
🟣 AUPSR stood at 68.66% on November 12, compared with the current bear market’s low of 56.4%. Although further price declines may push the indicator lower, the expectation is that it will hold above 56.4%, consistent with previous bull-market patterns. 🙏
foredex.io/charts/on-chain/b…

价格确定跌穿STH-RP,$BTC也进入了6字头的价格区间。
市场好像开始进入一段牛熊分不清的痛苦时期。
依照我们之前的计划:
担心重回熊市、在价格跌破STH-RP后就开了空单的朋友,目前可以先继续持有。
主要原因是市场整体还处在恐慌期,这张空单的目的不是为了赚钱,而是为了“保护仓位”。
所以等到市场情绪好转,或是价格重新站稳STH-RP之后,再来考虑平仓就可以了。
至于选择死守的朋友,这几天的持仓体验一定非常不好,心里可能也开始自我怀疑:这难道只是熊市的中继反弹?后面还有更深的底部吗?
别急,这边再提供一组数据来帮大家按摩一下心理!
这个指标叫做Adjusted Unrealized Profit Stress Ratio(AUPSR)。
它主要是追踪剔除ETF数据影响后,链上原生筹码的“未实现盈亏压力比”。
从过往经验可以发现:
🟣在每一轮牛市初期,价格并非都一帆风顺,中间一定会伴随着不间断的回调。
🟣而每一轮的回调中,除了最重要的STH-RP支撑之外,过往几轮牛市回调,通常也都不会跌破熊市底部的AUPSR数值。
看回目前的数据:
AUPSR在11/12回到了68.66%,而本轮熊市的最低点落在56.4%。
虽然今天的再次下跌可能会让数据继续下探,但理论上应该还不至于跌破前低(56.4%)。
只能说最近的价格走势虽然让人感觉痛苦,但数据上看来,仍然还有希望。
数据来源:@ForeDex_Global

1
6
619