

Weather + Climate | Look Up 🚀 | Florida State PhD + Michigan Go Blue! | Cat 6 🐈 | SI @weathertrader | Maps at @ForecastEagle + https://nitter.cf/t.co/RZoMToAx1q
Atlanta, GA
Joined September 2008
- Tweets30.9K
- Following5.9K
- Followers155K
- Likes74.5K





Ryan Maue retweeted

WeatherQB multiview - 12pm ET window
The 12 PM college football window: Wisconsin at Iowa is the only one with rain, about 55% at kickoff and drying out by the second half. Notre Dame-Navy in Foxborough: 50°, breezy, gusts near 19. Arizona-Texas Tech and Auburn-Ole Miss: dry, light wind.

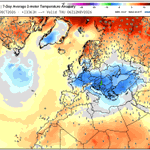
Friday Weather Blog update on upcoming weather across the US and Europe ... plenty of weather maps and animations (colorful) to tell the story!
Weather is beautiful when you can visualize it in motion.
Plenty of topics -- including Atlantic hurricane season still going w/Southern Caribbean interest.
weather.substack.com/p/octob…
Amazing to see this! 🌵
Arizona will be the wettest state by volume with over 3.2 Trillion gallons of additional rainfall over the next 3-days. 🌧️
⚠️ Risk of flooding -- be careful in canyons and on the roadways in Phoenix.
Anytime we see trillions on the map for Arizona, all of the lizards and cacti get excited. 🦎


Ryan Maue retweeted

"Uncharted Territory": Arctic Vortex Could Break Earliest On Record zerohedge.com/weather/unchar…


Ryan Maue retweeted

The 2027 Mount Washington Observatory calendars are available at lulu.com/spotlight/mwo231
Order NOW and use the code EARLY20 at checkout to get 20% off your order! Code EXPIRES at 2359 EDT on 10/30!
Pick up your favorite today and enjoy a year of Mount Washington images! 🏔️📅🐱

Time travelers

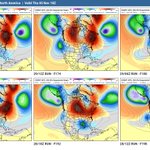
❄️🌀🌎 Early November 2026 — Stratospheric Warming Signal
Early-November Polar Sudden Stratospheric Warming (SSW) Signal | 3–10 November 2026
The latest structural-analog analysis is showing a notable increase in the likelihood of a possible early-November sudden stratospheric warming episode during 3–10 November 2026, with the signal particularly pronounced across the Eurasian and North American sectors. This early November SSW had also oddly materialized in November 2025, which is considered a rare event .
The forecast is based on 20 candidate structural analogs for November 2026, with the resulting pattern remaining robust after resampling across 10 independent random-season ensembles.
The 10-hPa temperature composite shows a pronounced positive temperature anomaly across the Arctic/polar stratosphere, with the strongest warming extending through the Eurasian and North American sectors.
The accompanying 100-hPa vector-wind composite also indicates a highly disturbed circulation pattern around the polar region, providing additional evidence of an anomalous large-scale dynamical configuration during the same period.
⚠️ Important: This is not a confirmation of an SSW event. At this stage, it represents an analog-based probabilistic signal. Confirmation would require the dynamical evolution to produce the characteristic weakening and/or reversal of the 10-hPa polar-night jet, particularly in the zonal-mean winds near 60°N.
The next level of verification is therefore to examine the 10-, 30-, 50-, and 100-hPa circulation structure, including the evolution of the polar vortex and the potential role of upward-propagating planetary wave-1 and wave-2 activity.
If the temperature and wind signals remain dynamically coherent as we approach November, the case for an early-November stratospheric disruption becomes considerably stronger.
🔹 Forecast window: 3–10 November 2026
🔹 Method: Structural Analog Modeling + Random-Season Resampling
🔹 Candidate analogs: 20
🔹 Validation: 10 independent random-season ensembles
🔹 Primary diagnostic: 10-hPa polar temperature
🔹 Dynamical support: 100-hPa vector-wind structure
See the previous forecast for Nov SSW signal found from June in the comments please .
Statistical Model by @Statisticizer
🔋Powered by Aviatech Jordan & UAE-Dubai — Poultry Farm Equipment & Integrated Farming Solutions
Aviatech Jordan
aviatech-mena.com/allservice…


🚨 This has never happened before.
The Super El Niño has triggered an unprecedented early November stratospheric warming event (SSW) and wind reversal.
100% chance forecast. We must prepare for weather and climate events that were otherwise impossible until now.


For El Niño (and La Niña or neither)
Please follow Professor Roundy from Albany

It's obvious that this whole El Niño event traces profoundly back to the collosal April westerly wind event. But also look at the right panel, it is obvious that the event is also depleting Pacific warm water volume, with integrated Pacific wide volume of water above the 20C isotherm has been declining since April. Although some of that excess heat went directly to space, much of it was transferred as sensible and latent heat into the atmosphere, which will be impacting weather outcomes over the next several months. The event will almost certainly lead to a period of heat deficit (relative to the long term trend line) in the climate system. It is interesting that the warmest naturally achieved heat signals reflect times with the earth is actually cooling.

It may seem counterintuitive but the warming causes cooling down the road.
Stratospheric polar vortex breakdown eventually works its way to our part of the atmosphere leading to massive dumps of cold air ... or Arctic blasts.
Hopefully the Super El Niño counteract the potential for record cold later in November.
Otherwise, I'm getting my snowblower out here in Atlanta.
Ryan Maue retweeted

Im Juli 1995 als Meteorologe der @tds auf der Schwägalp powered by @Samsung.
#ThrowbackThursday
(c) Urs Oskar Keller

I will entertain any and all theories linking the Hunga Tonga 🌋 eruption on January 15, 2022 and massive input of water vapor in the strarosphere to the fake El Niño of 2023, the weird polar vortex activity both Arctic and Antarctic, and the current Super Intensity El Niño due to westerly wind bursts.
Mind you, 1997 El Niño was post Pinatubo, similar timeline.
The slow background climate warming explains none of this. Everything is happening on top of the century scale global warming. I'm awaiting any explanation.
Ryan Maue retweeted

In development at gsdmsolutions.com: a new SSW monitoring page. Most views stop at “will the polar vortex break down/westerlies reverse?” This one lets you examine the event drivers and how likely it is to impact sensible weather. We try to lay out the whole causal chain: wave forcing from the troposphere, the vortex response and the way back down: anomaly descent, tropospheric coupling and high-latitude blocking. Included are days 1-15 forecasts from AIFS-ENS and 101-member ECMWF 46-day extended range ensemble, centered on the model’s own climate. Finally we leverage our 58-year CORe archive for historical context.
