

Chartered Market Technician (CMT) and Classical chart trader. Ex-Fund manager. 📈 ➡️ https://nitter.cf/t.co/VSwr0eryIS 📺 ➡️ https://nitter.cf/t.co/XFZI3RE8aj
Plovdiv, BULGARIA
Joined May 2011
- Tweets46.4K
- Following453
- Followers191K
- Likes14.2K



Pinned Tweet
Consider TechCharts Membership- Weekly Global Equity Reports, breakout alerts, Educational Video - Classic Charting. blog.techcharts.net/


$BTC The weekly candle completes end of day Sunday. That means from now onwards buyer's strength around support will define the type of candlestick and give us more insight into following weeks.

👇
Given the consecutive weekly losses for $BTC, if we hit 60K with a sell-off I will start looking for an oversold rebound. A long lower weekly wick can mark a short/medium-term low. That is what I'm monitoring around support. A long lower wick.

Aksel Kibar, CMT retweeted
#TECHCHARTSMEMBERS Latest #GLOBAL #EQUITY #MARKETS report is sent out.
3 breakdown #alerts
5 additions to #watchlist
blog.techcharts.net/2026/11/…

#TECHCHARTSMEMBERS Latest #GLOBAL #EQUITY #MARKETS report is sent out.
3 breakdown #alerts
5 additions to #watchlist
blog.techcharts.net/2026/11/…
Aksel Kibar, CMT retweeted

The King 👑.
Stanley Druckenmiller’s take on the current economy.
He’s basically out of the stock market:
Aksel Kibar, CMT retweeted

Note to disrespectful trolls
Here is the thing you do not understand about me -- it does not bother me to be wrong. Fully 45% of our trades every year are losers.
Often one interpretation that is wrong leads to another that is wrong that needs finally to a trade that works. Sorry to tell you, taking losses is one of the most important tasks facing professional traders.
While being OK with being wrong is a key to trading success, the need for trolls to be right (and remind others when they are wrong) is the reason 95% of trolls lose money in the markets.
When you respond to a chart I post with some nasty gram, are you not aware that is an act worth of those failing in their trading

#COPPER dragged it down.

$BCOMIN #INDUSTRIAL #METALS index is rolling over. Caution with price action below the 200-day average (40 week EMA). #COPPER can drag this down.

When most #emergingmarkets currencies weaken against the Dollar, $USDINR does well.
Respect the chart signal. Don't try to second guess.


Act only with the signal. A short signal on $COIN is only a short signal on $COIN
Each chart on its own merit with its own risk levels.

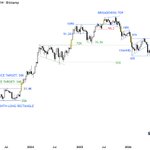
Don't take this as a prediction. We have a signal. I've been n covering this setup in the latest reports. This week the breakdown is confirmed. Respect Last Full Day High and pattern negation level. A rectangle and a larger scale H&S top $COIN
Note: Last Full Day High and Pattern Negation levels are for the 9 month-long rectangle completion.
More on these setups >> blog.techcharts.net


$BTC The weekly candle completes end of day Sunday. That means from now onwards buyer's strength around support will define the type of candlestick and give us more insight into following weeks.
$BTC compared with previous breakout/breakdown candles (highlighted at several horizontal breaks) this breakout above 82.8K is hesitant and lacks momentum. Price can drop back inside the range 82.8K-60K.
More with the upcoming report >> blog.techcharts.net


The weekly candle completes end of day Sunday. That means from now onwards buyer's strength around support will define the type of candlestick and give us more insight into following weeks. $BTC

Given the consecutive weekly losses for $BTC, if we hit 60K with a sell-off I will start looking for an oversold rebound. A long lower weekly wick can mark a short/medium-term low. That is what I'm monitoring around support. A long lower wick.
Rectangle can act as a top reversal.
Fear is a stronger feeling than greed. That is why we see breakdowns reaching their price objectives in a short time period than breakouts.
The only challenge with capturing breakdowns is that you need to spot them early. Because an oversold market usually results in wide swings and late joiners to the sell-off end up failing to reach their price targets.


Let these be inspirations for you to open your own charts and study price action.
More on #GLOBAL #EQUITY #MARKETS with tomorrows report >> blog.techcharts.net
Last several posts featured weekly scale charts and breakouts. Breakout confirmations are decided intr-week on a daily close above the threshold.
"Last full day low" is the low of the full day before the breakout confirmation day.
It is not a magical number. It serves as some wiggle room in case there is volatility right after the breakout. It can be utilized as a protective stop.

33
14,162
Last several posts featured weekly scale charts and breakouts. Breakout confirmations are decided intr-week on a daily close above the threshold.
"Last full day low" is the low of the full day before the breakout confirmation day.
It is not a magical number. It serves as some wiggle room in case there is volatility right after the breakout. It can be utilized as a protective stop.
At the time of the breakout, it is hard to know if the breakout will fail or succeed. It is usually following the breakout, the follow through with momentum that offers more insight into the type of trend we are dealing with.
As I mentioned in previous posts, utilizing last full day low as a protective stop is what you can control.

At the time of the breakout, it is hard to know if the breakout will fail or succeed. It is usually following the breakout, the follow through with momentum that offers more insight into the type of trend we are dealing with.
As I mentioned in previous posts, utilizing last full day low as a protective stop is what you can control.
You have seen with $BTC price action above 82.8K that hesitant price action following the breakout confirmation is not a good sign for momentum.
Similar failure can be seen below on a previous breakout alert.
Utilizing the last full day low as a protective stop can be a good choice.

Aksel Kibar, CMT retweeted

What might $TGT outperforming $SMCI imply about the market right now? 🧵👇
They aren't competitors, so it comes down to risk appetite. Outperformance by a legacy retailer over an AI server play usually points to profit-taking in crowded tech trades, hardware margin pressure, and a flight to steady cash flows.
