

ex-Bridgewater | now tweeting alpha for free my Telegram for cooperation: abclogic
JOIN MY TG →
Joined January 2021
- Tweets5K
- Following50
- Followers1.9K
- Likes6.5K


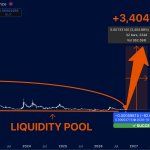


$INJ looks like the kind of chart nobody wants to touch.
And that's exactly why I can't stop looking at it.
Years of pain, price back near its historical base
and the first signs of life on the weekly.
$16.5 → $35 → $53 if this reversal actually gets going.
People will call you insane for watching it at $7.
They'll call you a genius if it reaches $50.
Funny how that works.

$SUI at $0.93 looks absolutely ridiculous to me.
Down 85% from its previous peak.
Everyone was excited about $SUI above $5.
Now barely anyone wants to touch it.
Funny how that works.
I'm watching the liquidity zone closely.
My long-term target? $12.
That's over 2,000% upside from the chart's base.
Call me crazy, but I think $SUI has another massive run left in it.

$NEAR at $4.41 still looks ridiculously cheap to me.
The first target at $3.24 is already behind us.
Next stop? $9.
And if the market really goes crazy, $20 isn't off the table.
That's nearly 5x from here.
I think people are seriously underestimating this one.

$NEAR at $4.41 still looks ridiculously cheap to me.
The first target at $3.24 is already behind us.
Next stop? $9.
And if the market really goes crazy, $20 isn't off the table.
That's nearly 5x from here.
I think people are seriously underestimating this one.

$BNB to $3,000?
Everyone is focused on short-term price action.
I'm looking at the bigger picture.
Years of higher lows. A massive liquidity zone below.
And a trendline pointing MUCH higher.
If this structure holds, $3,000 is my long-term target.
Sounds crazy now.
But so did $1,000 $BNB a few years ago.


I'm not saying $BCH will hit $2,400 tomorrow.
But if we get another major altcoin expansion
I wouldn't be surprised to see this old dinosaur outperform coins everyone is chasing today.
My long-term target is $2,400.
That's roughly 10x from here.
Sounds ridiculous?
So did plenty of moves before they happened.

$TAO at $253 looks like one of the most interesting setups in crypto right now.
Look at the weekly chart.
The same support zone has held multiple times
and price is now challenging a descending trendline
that's been keeping bulls trapped for almost two years.
I think a breakout could change everything.
My upside target? $1,350.
That's a potential +472% from here.
Most people will only start paying attention when $TAO is back above $500.
I'd rather watch the setup before the crowd arrives.
Are you bullish on $TAO?

$INJ at $7.67 looks ridiculously cheap to me.
This coin was trading above $50
and now most people have completely forgotten about it.
But look at the weekly chart.
Higher lows are forming, and the structure is starting to look interesting again.
My targets:
$16.52
$35.15
$52.93
And if the next altcoin cycle gets crazy
I wouldn't rule out $80+.
That's over 5,000% potential upside from the marked entry on the chart.
Sounds insane?
So did the last bull run before it happened.
I'm keeping a close eye on $INJ.

$ZEN at $5.63.
Five years ago, people were buying this above $150.
Today, most traders probably couldn't even tell you what $ZEN is.
And that's what caught my attention.
The weekly chart shows years of trading near the bottom
with previous rallies repeatedly fading back into the same zone.
My recovery targets:
$45.54 - first major resistance
$137.68 - previous cycle territory
$168.18 - historical resistance
The extreme bullish scenario stretches toward $250+
representing roughly 5,600% from the projected base.
Is that realistic without a massive shift in demand? No.
But if capital starts rotating into forgotten altcoins
$ZEN is one of the charts I'll be watching.
Sometimes the most interesting opportunities are hiding in coins everyone stopped talking about.

Imagine telling someone in 2021 that $FIL would be trading below $1 five years later.
They'd probably laugh in your face.
Yet here we are.
What's interesting to me isn't how far Filecoin has fallen.
It's how long the price has been sitting near the bottom.
The market has practically written it off.
But if this accumulation zone holds and momentum returns
I see $118, $237 and even $430 as possible long-term targets.
That's a ridiculous upside scenario from here, and I know how unlikely it sounds.
Still, I wouldn't be surprised if one of the most hated charts in crypto ends up becoming one of the most talked about.
Would you touch $FIL at these prices?

I'm watching what $ONDO is building.
Look at the daily chart.
Higher lows, a rising trendline, and buyers slowly taking control.
This is exactly the kind of structure I like to see before a major move.
My targets:
$0.4487 - first breakout level
$0.4875 - next resistance
$1.1686 - major upside target
And if momentum really kicks in
$1.60+ becomes my aggressive scenario.
That's roughly 270% above the current price.
The interesting part?
Most people won't pay attention until the chart is already flying.
I'm watching the breakout closely.
Are you holding $ONDO?

$QNT just reminded everyone why you never ignore a sleeping giant.
From $66 to over $200, and suddenly nobody's calling it dead anymore.
But here's the crazy part.
$QNT is still far below its $427 ATH.
And my long-term target sits around $700.
That's another potential 3x+ from here.
I'm not saying it'll happen overnight.
But after years of watching this chart go nowhere
I think the real move might only be getting started.
Would you sell at $400 or hold for $700?

$INJ spent months building a base near $3–$5.
Now buyers are starting to show up again, and the weekly structure is looking increasingly interesting.
Here's what I'm watching:
$16.52 - First target
$35.15 - Second target
$52.93 - Final bullish target
That's a potential +4,707% move from the chart's measured low, not today's price.
Of course, the recovery still needs confirmation.
But here's the funny thing about crypto:
people ignored $INJ near $4, yet if it returns to $35
everyone will suddenly call it an opportunity.
I'd rather watch the comeback early than chase it later.

$XLM could be setting up for something absolutely insane.
I'm looking at the long-term chart, and one thing stands out.
Every major rally started when $XLM was trading near the bottom of its historical range.
And guess where we are now?
Right back near that zone.
The upside trendline points toward $2+
which would represent a potential +3,069% move from the marked low.
Sounds ridiculous?
Maybe.
But I've been in crypto long enough to know that the biggest opportunities often look ridiculous before they happen.
I'm not saying $XLM will hit $2 tomorrow.
The market still needs to confirm a reversal.
But I'm definitely not ignoring this chart.
Would you hold $XLM for a potential 30x?

$AERO is starting to look seriously interesting.
While everyone is chasing alts that have already pumped
I'm watching the ones quietly building momentum.
Look at the weekly chart.
First target at $0.6315 has already been cleared. Now I'm watching:
$1.5823
$2.2198
$3.77 - +1,100% potential
The structure is improving, and previous resistance levels could become the next major targets.
Of course, nothing is guaranteed. But if the broader market turns bullish
I wouldn't underestimate $AERO.
The biggest opportunities rarely look obvious at the beginning.

$TIA went from $21 to just $0.61.
Almost everyone who bought near the top is underwater.
Sentiment is terrible.
Most traders have already moved on.
But look at the weekly chart.
Price is sitting in a massive historical discount zone.
If $TIA manages to reverse its long-term downtrend
even a partial recovery could deliver insane returns.
My ambitious target? $29.
That's a potential +7,000% from the marked low.
Sounds ridiculous?
Maybe.
But crypto has a habit of making the impossible look obvious in hindsight.
Would you buy $TIA at these levels?

$RAY at $1.78 looks like one of those setups people ignore until it's too late.
Remember when it traded at $17.87?
Then came a brutal 95% collapse.
Years of gains wiped out.
Now price is recovering from a major historical liquidity zone.
And here's the crazy part.
My long-term target is $31.
That's nearly +5,900% from the marked bottom.
Sounds ridiculous?
So did the last bull run before it happened.
I'm watching $RAY closely.
The upside scenario is massive, but the recovery still needs confirmation.

$RENDER is sitting at a level most people won't even look at anymore.
Years of price action, a massive liquidity pool below
and buyer pressure starting to recover.
Everyone loved RENDER at $10.
Now it's around $1.84, and suddenly nobody cares.
My eyes are on the long-term trendline near $23.
That's over 5,000% upside if this scenario plays out.
The biggest opportunities rarely look attractive at the bottom.

$LUNC TO EXPLODE AGAIN?
+3,760% POTENTIAL.
Everyone remembers the collapse of $LUNC.
But almost nobody is talking about what the weekly chart looks like right now.
Price has spent years consolidating around the same liquidity zone.
And the historical resistance levels are interesting:
$0.00018122 - Target 1
$0.00027702 - Target 2
$0.00064578 - Target 3
That final target represents a potential +3,760% from the chart's marked low.
Crazy? Sure.
But I've learned one thing in crypto:
the alts everyone has given up on can sometimes deliver the biggest surprises.
I'm watching $LUNC closely.
A breakout with real volume would make this setup much more interesting.
