

Certified Financial Technician - CFTe | Financial Analyst & Educator | Media Presenter | Keynote Speaker | News Corp columnist | Founder of MtM
Joined January 2022
- Tweets4.7K
- Following101
- Followers22.1K
- Likes3.7K


Pinned Tweet
Pretty cool milestone to share.
Due to the success of the weekly online articles, my ASX Trader column will now also be published in print every Tuesday across the major News Corp newspapers.
So if you're old school like me and still enjoy grabbing a physical paper, keep an eye out each Tuesday in publications including The Courier-Mail, The Daily Telegraph, the Herald and other News Corp papers around Australia.
The print edition will be a condensed version, to fit on one page, of my weekly online article, breaking down what I'm seeing across markets, where money is flowing and the areas I'm watching next.
This week we're looking at why the miners are starting to outperform the metals themselves, particularly across gold and silver, and why Australia's emerging companies (small caps) could be approaching an important period.
There's still something pretty cool about seeing your work in an actual newspaper.
Grab yourself a copy every Tuesday. 🗞️📈

For the past few weeks, I've been sharing an abundance of evidence pointing towards a correction in the NASDAQ.
I've written multiple News Corp articles, shown the deterioration in market breadth, how historically extended the market has become, the growing divergences and countless other warning signs.
And now? The market is doing exactly what the data suggested it could do.
This is why knowing when to play defence is just as important as knowing when to play offence!
I can't tell you how many times I've watched a sporting team build a massive lead, only to throw it all away because they didn't know when to switch from offence to defence.
Investing is no different.
There's no point building up enormous unrealised gains if you don't know when to protect or realise them.
This is exactly why we've spent weeks preparing, positioning portfolios defensively, putting hedges in place and keeping cash available.
Those who weren't prepared could be facing some serious portfolio damage right now.
But here's the exciting part!
I believe we're going to see some phenomenal buying opportunities in the commodity space over the coming weeks.
And I've got plenty of cash sitting on the sidelines, with my shopping list ready to go.
I genuinely can't wait!
Remember, successful investing isn't just about making money when markets are rising. It's about protecting that wealth when conditions change so you're ready to take advantage of the next opportunity.
Preparation is the key to success!

NASDAQ: WHY I'M PLAYING DEFENCE!
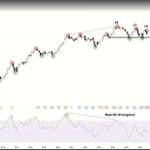
I'm seeing some warning signs in the Nasdaq that suggest we could be heading into a decent correction.
Most people watch the Nasdaq 100, but the problem is that a handful of big tech companies can hide weakness across the rest of the market.
That's why I also watch the equal-weighted Nasdaq (NDXE).
A few things concern me:
1. Bearish RSI divergence, showing momentum is weakening.
2. Multiple failures to break resistance around 10,300–10,400.
3. The September low around 9,800 is critical. If that breaks, the technical picture becomes much more bearish.
Does this mean we're definitely going lower? Of course not.
But trading is about probabilities, not predictions.
Right now, I think the risk of a decent correction is high enough to justify playing defence.
I'll happily turn bullish again when the charts give me confirmation. Until then, protecting capital is my priority.
Remember, you don't need to catch every rally. Sometimes the best trade is simply staying out of trouble.
What do you think? Another leg higher or a bigger correction coming?

Alphabet (Google) has plunged over 13% following weaker-than-expected earnings, wiping more than $520 billion off its market value.
During my Wednesday US Market Scan, I highlighted some major warning signs appearing across the big US tech stocks.
Here's a clip of my analysis on Google, before the earnings announcement and today's massive sell-off.
This is a great example of why I always say the charts often lead the news.
The warning signs can appear in price action well before the headlines give everyone a reason for the move.
This is why understanding market structure and technical analysis is so valuable. Rather than reacting to the news, you're learning to recognise changes in the market before they become obvious to everyone else.
We're in a Bear Market. Most People Just Haven't Realised It Yet.
Yesterday on The Call on Ausbiz, I explained something that I think a lot of investors are missing.
Markets don't have to crash to experience a bear market.
Markets can correct in two ways:
Through price, where markets fall sharply.
Through time, where markets move sideways for months or even years while individual sectors experience their own bear markets.
And that's exactly what we've been seeing throughout 2026.
Take a look at the chart.
The ASX 200 has essentially gone sideways this year. But look beneath the surface.
Four sectors have delivered the strongest gains in 2026:
Energy +31.76%
Consumer Staples +17.28%
Utilities +10.07%
Materials +8.85%
Meanwhile, Information Technology is down 23.73%, Real Estate is down 14.39%, and Consumer Discretionary is down 7.60%.
This is sector rotation in action.
Money has been moving away from growth-sensitive sectors and towards defensive areas of the market, alongside energy and materials.
And this is exactly what I discussed in my free 2026 market outlook webinar at the beginning of the year.
Those who attended saw the macroeconomic data and warning signs developing in real time, allowing them to consider rotating from growth towards defensive sectors before much of this unfolded.
One area I was particularly focused on was Healthcare.
I explained that one of my main objectives for 2026 was identifying a potential secular low in the Healthcare sector, following years of underperformance.
And look what's happened since June.
Healthcare has experienced an extraordinary recovery, with some major stocks rallying around 50% or more from their lows.
CSL was one of the opportunities I identified, and my position has returned approximately 100% in just a few months.
But the important lesson isn't the return.
It's understanding why capital rotates between sectors at different stages of the economic cycle.
And here's something particularly important for property investors.
There's a lot you can learn about the property market by looking outside the property market.
Interest rates, bond yields, unemployment, credit conditions and sector rotation all provide valuable clues about the broader economic environment.
The share market can begin reflecting changing economic expectations long before those changes become obvious in property prices.
You don't need to invest in shares to benefit from understanding what the share market is telling you.
That's why I spend so much time studying the relationships between property, shares, commodities, bonds and the broader economy.
Because the more you understand how these markets interact, the better equipped you are to recognise changes in the cycle.
The biggest mistake is assuming that because the index isn't crashing, nothing is happening beneath the surface.
Sometimes the most important market changes happen while the headline index goes nowhere.
Preparation is the key to success. Education pays dividends.


Interesting research, especially following the property-to-shares ratio I shared last week, which suggested Australian property is historically expensive relative to Australian shares.
New modelling now suggests a diversified ETF portfolio could outperform investment property under the proposed tax reforms.
When comparing property and shares, you need to consider the total costs, including mortgage interest, maintenance, insurance, stamp duty, taxes and ongoing fees.
One argument often made in favour of property is leverage, which allows investors to control a larger asset with less upfront capital.
However, leverage isn't free, particularly when borrowing costs are elevated. And it only benefits you when the asset is going up, which it currently isn't. Seems simple because it is.
And something many investors don't realise is that you can leverage shares too.
For example, GEAR on the ASX provides approximately 2 to 2.86x leveraged exposure to Australian shares. There are no monthly mortgage repayments, but borrowing costs are built into the fund.
Of course, leverage works both ways. It magnifies gains during bull markets and losses during bear markets.
And let's be clear, diversification is important.
Having exposure to both property and shares can play an important role in building long-term wealth.
But diversification doesn't mean having equal exposure to everything all the time.
It's about understanding valuations and market cycles, recognising when one asset class offers better value than another, and adjusting your exposure accordingly.
Neither property nor shares will always outperform.
The real question isn't which asset class is better.
It's which asset class offers better value at this particular stage of the cycle.

New modelling shows how property investors fare compared to Aussies holding shares under the new budget reforms. There’s a clear winner. Full story: bit.ly/4BwEQQ1

The Biggest Lie About Financial News.
Last week, I spent the day at Newscorp headquarters recording a one-hour masterclass that will be going out to their database, reaching an audience of millions.
And it got me thinking about the media and how much my perspective has changed since I started working in it.
Years ago, I used to wonder whether the media was somehow being paid by big institutions to help them offload their investments at the top of market cycles.
But after working in the media myself, I've come to understand something.
The media is a business.
And like any business, it needs to make money. Most media businesses rely heavily on advertising revenue. The more people reading and watching, the more valuable that advertising becomes.
So what gets the most attention?
Fear, excitement, hype and whatever everyone is already talking about.
This is why you'll often notice the media jumping all over investments during the excess phase of a market cycle, right when everyone is interested and prices have already experienced enormous rallies.
But where were those headlines during the accumulation phase?
Usually nowhere to be seen.
Why? Because accumulation is boring. Nobody wants to read about an asset that's been going sideways for years. There's no excitement, no hype and very little public interest.
And that's exactly what I wanted to change when I started writing my weekly financial column.
I didn't want to tell people where the market had been. I wanted to help them understand where it could be going.
Think about some of the biggest financial headlines you've seen over the past year.
Gold, silver, platinum, gold miners, copper, the Bitcoin top, the housing market top, rising interest rates and the aggressive rate hikes returning in 2026.
These are all topics I've been writing about before they became mainstream headlines.
I was discussing the opportunities in precious metals during accumulation, not after everyone had piled in.
I was warning about the final run-up in gold and silver and the potential for a major top around February to April in 2026. I talked about energy being the best opportunity in 2026. I was discussing the risks of a Bitcoin top, the Australian housing cycle turning, and the potential for interest rates to rise aggressively again in 2026.
The difference? I wasn't waiting for these stories to become headlines. I was using historical data, market cycles and technical analysis to identify them before the crowd caught on.
Of course, not every forecast will be right. That's the nature of financial markets. But I'd much rather use data to anticipate opportunities and risks than simply report on what has already happened.
And what's been fascinating is that my articles have gone on to become one of the most-read articles in the business section.
It tells me people actually want something different. They want to understand WHY things are happening and, more importantly, what could happen next.
Which brings me back to last week's masterclass.
I've packed pretty much everything I've learnt over the years about identifying market cycles, spotting opportunities before the crowd, understanding risk and using data to make better investment decisions into this one-hour session.
It's probably one of the most comprehensive masterclasses I've put together.
And I'm genuinely excited to get this education out to the masses.
It should be released sometime soon, so keep an eye out!
Remember, the biggest opportunities rarely make headlines when they're actually opportunities. They make headlines when everyone else has finally noticed them.


At what point will people finally realise that energy is in a bull market?
This is what we call the disbelief stage of a bull market. It's exactly what I saw with silver in early 2025.
Everyone thinks energy is only rising because of the war. They're scared to invest because they believe that once the war ends, energy prices will collapse and the sector will return to a bear market.
But here's what they're missing.
Energy was already showing extremely bullish signs long before the war even started.
The war didn't create the underlying bullish market structure. It simply gave people a reason to explain the move.
That's the beauty of studying long-term market cycles. While everyone else is focused on today's headlines, the charts can be telling a completely different story.
Bull markets often begin when most people still don't believe they're real.

David Bird (ASX Trader) B.Ed, CFTe retweeted

It made an explosive move and is now deep in the trenches of a dive. But this asset is trading at a 60 per cent discount that could define the next commodity boom, writes ASX Trader. ✍️ READ MORE: bit.ly/48dMUHR

THE STOCK MARKET DOESN'T CRASH. IT REVERTS TO THE MEAN!
The other week, I talked about how markets don't just crash, they revert to the mean, and how valuations eventually reset when prices become too stretched.
Well, let me show you how this plays out on the S&P 500 weekly chart, dating back to 2018.
The blue line represents the 100-week moving average, which is simply the average price over the past 100 weeks.
Now, notice something interesting?
Almost every major correction highlighted on this chart occurred after the market had moved approximately 15% to 20% ABOVE its moving average.
And what happened next?
The market corrected back towards that average!
Even before the COVID crash, the S&P 500 was already around 18% above its moving average. COVID was the catalyst, but the market was already extremely stretched.
Then panic took over, and prices fell more than 20% BELOW the average.
And what happened next? Mean reversion again!
SO WHERE ARE WE TODAY?
Once again, the S&P 500 has recently been trading around 15% to 20% above its 100-week moving average.
So when we eventually experience another significant correction, is it really a crash?
Or is it simply a market that's moved too far, too quickly, and needs a healthy retracement?
BUT HERE'S THE IMPORTANT PART!
This behaviour is particularly common during bull markets, where the moving average often acts as support.
However, during major bear markets, like the GFC or dot-com crash, things can change dramatically.
Instead of bouncing off the moving average, prices can break below it and continue falling.
That same moving average can then become RESISTANCE rather than support. And that's why understanding the broader market cycle is so important.
Remember, Markets don't move in straight lines forever. They become overextended, correct, recover and repeat.
Mean reversion doesn't tell us exactly when a correction will happen, but it helps us understand when markets are becoming stretched.
Sometimes what everyone calls a market crash is simply an overextended market returning towards its long-term average.
The real question is whether that correction is happening within a bull market or marking the beginning of a bear market.

TEXTBOOK ACCUMULATION!
FCG, the natural gas ETF, has spent the last 10 years in what looks like textbook accumulation.
A beautiful inverse head and shoulders pattern, with price breaking through the neckline and successfully retesting it this year.
Now we're approaching a major descending resistance line stretching all the way back to the GFC highs on fantastic volume!
What I find hilarious is that people still haven't clued on that energy is in a bull market.
Energy has been one of the easiest trades of 2026, yet so many still believe the strength is temporary and simply driven by the war.
I love it!
The bigger the accumulation, the bigger the potential move.


David Bird (ASX Trader) B.Ed, CFTe retweeted

Three new voices are taking the CryptoCon stage. 🚀
Speakers from @MtM_Australia are joining the conversation, bringing fresh perspectives from across crypto, blockchain, Web3 and digital assets to help you cut through the hype and stay ahead of what’s next.
More voices. More insights. More speakers coming soon...
📍 ICC Sydney
📅 28–29 November 2026
🎟️ FREE General Admission
David Bird @ASX__Trader | Mastering The Markets
Founder
Industry: Stock Market Investing
Craig Tapping | Mastering The Markets
Head Educator and Analyst
Industry: Trading / Investor Education
@tungasaurus | Mastering The Markets
Educator
Industry: Investment Education / Macro Investing
#CryptoCon #CryptoAustralia #Investing #StockMarket
Worth a watch if you want to understand what is happening right now.

The market’s next winners could be yesterday’s laggards. 👀
Mastering the Markets’ David Bird reveals the sectors he thinks are primed to outperform — and where he sees trouble brewing ☕
Catch the full interview here 👉 ausbiz.co/4i22SLa
#asx200 #toppicks #technicals #ausbiz

Most people will be blindsided by what's coming, just like they were with the housing crash.
Preparation is the key to success

On the 20th of July, I appeared on @ausbiztv 'The Call', where we discussed NEXTDC (NXT).
Now, don't get me wrong. The data centre thematic is incredibly strong. Cloud computing and AI are booming, and the amount of money being poured into this space is extraordinary.
But there's a big difference between a great industry and a great investment.
I shared two of my favourite sayings:
"Money never leaves the market, it just rotates from overvalued to undervalued."
"The market loves what you hate and hates what you love."
And this is exactly why I was concerned about NEXTDC.
Everyone loved the stock. Sentiment was extremely bullish, and that's often when I start getting cautious.
Why? Because when everyone wants to own something, who's left to buy?
The charts were already telling us something wasn't right.
We had bearish divergence forming around $18, followed by lower highs around $17 and $16.
I specifically highlighted the $11 level and warned that if it broke, we'd see a change in market structure and things could turn bearish very quickly and to get out as fast as you can. Charts led the news.
At the time, I also explained why I believed we were seeing a massive rotation out of growth sectors and into more defensive areas of the market.
Fast-forward to today.
NEXTDC broke below $11, and just look how quickly things turned bearish!
It's another great reminder that you can have an incredibly bullish long-term story, but that doesn't necessarily mean the share price is going higher.
Price action is king.
Mastering the Markets Pty Ltd (ABN 99 671 639 704) is a Corporate Authorised Representative (CAR 001309433) of ShareX Pty Ltd (AFSL 519872). Content is general educational information only, not personal financial advice, and does not consider your individual objectives, financial situation or needs. Please consider your own circumstances and seek independent financial advice before making any financial decisions.


PLATINUM: IS THE BULL MARKET OVER, OR HAS IT ONLY JUST BEGUN?
One thing I've learned over the years is that you can gain a lot by studying the personality of a chart.
Every asset has its own characteristics, and when you zoom out, some of these cycles become incredibly obvious!
Those who follow me will remember that back in May 2025, when platinum was below US$`1,000, I wrote about why I believed it was preparing for an explosive move higher.
couriermail.com.au/business/…
And explode it did, surging towards US`$3,000!
But was that the entire move, or is there something much bigger still to come?
LET'S LOOK AT THE LAST 50 YEARS.
1970s: Look at the first green arrow. Platinum broke out, experienced a deep retracement, and then went on a powerful bull run that peaked in 1980 at our first red arrow.
What followed was a brutal 20-year bear market!
2000: After two decades, platinum finally broke its declining trend again. And guess what happened?
Almost exactly the same thing!
A breakout, a deep retracement, followed by another powerful bull market that peaked in 2008.
Then came another 17-year bear market!
2025: Platinum finally broke that long-term declining resistance again, exactly what I highlighted back in May.
And once again, we've seen an explosive move higher followed by a significant correction.
See the pattern?
BREAKOUT → DEEP RETRACEMENT → MULTI-YEAR BULL MARKET.
That's the personality of platinum!
SO WHERE COULD IT GO NEXT?
Look at the long-term rising channel. Both the 1980 and 2008 peaks occurred near the upper resistance line.
If history repeats, that upper resistance could eventually take platinum towards US 6,500 over the coming years.
That's our next red arrow!
Of course, nothing is guaranteed. But what fascinates me is that the previous two bull markets developed over many years, yet people are already declaring this one finished after its first explosive move.
Markets don't move in straight lines. They zig, they zag, and often shake people out before the larger trend continues.
Maybe this time is different. But if platinum is following its historical personality, this bull market could have years left to run!
