

Independent research. BTC · ETH. Macro overlay, data-driven analysis. https://nitter.cf/t.co/hWkXHAFTc5 | Not investment advice.
Joined December 2020
- Tweets1.6K
- Following2.4K
- Followers926
- Likes114K





Pinned Tweet
$ETH is securing $164 billion in stablecoins. Its market cap is $239 billion.
Those two lines rarely diverge this much. 🧵1/

Finding the right fair value for $BTC has been tough, and I've tried a lot of approaches. The one that has held up best for me is the cost to produce a bitcoin.
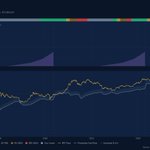
The Opportunity Signal is built on that, using three components. Going through them one at a time 🧵 (1/6)
1
1
224
Third is halving urgency. Roughly every four years the mining reward gets cut in half, which in theory nearly doubles the cost to produce a bitcoin.
The score slowly builds as the halving gets closer, then resets to zero after it until the next one approaches. (5/6)

1
15
Add them together and we get the composite score. Historically a higher score has lined up with better times to accumulate, and it's back above 40 now, at 46.
The live interactive chart is in the link below
alphalineresearch.com/charts… (6/6)

15
Alphaline Research retweeted

👏👏👏
So you’re tell me BTC is winning and it just keeps on winning… it ascended to boredom so soon.
It’s too cutting edge for most conservative investor folk.
Too new-fangled for most nation state sovereigns.
… but the score card is 17 years vs 5000 for gold.
You and your buddies were all early to BTC, you rode the rise, but it’s not for your 10 year seed to IPO attention span.
Go onwards and fund your Dyson swarms and call BTC boring. It’s exactly what BTC needs to win.


Once again, watch the crypto equities, not the spot cryptos

A few clues for where $BTC could be heading based on the relative underperformance today
40
A few clues for where $BTC could be heading based on the relative underperformance today


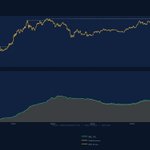
I think the collective CT angst towards $ETH can be summed up in one graph, while the slow, but growing optimism from institutions is seen from a different angle
A 🧵of two images:
CT sees the general lackluster performance of DeFi and the lack of asset growth on #Ethereum (DeFi TVL is the gray area)


Nice! Looks similar to my proxy signal (vol. spike + Drawdown + miner cost)
nitter.cf/i/status/2045698991053…

I keep seeing comparisons of early/mid bear market price action from prior declines for #BTC
Here is where the issue lies...
The dozens of bottom signals only flashed in synchrony at the bottoms
They were not flashing in the middle
Yet they all flashed in Q1 2026 at 60k
So to compare the current price action to mid bear market price action has major visible flaws because you did not have bottom signals flashing in the middle; they flashed at the bottoms
80
The fundamentals of $BTC have been improving over the past 30 days alongside price.
The production cost of BTC has risen 11% over the past 30 days, while the BTC price is up 16%.
Track charts like this and more here: alphalineresearch.com/charts…

45
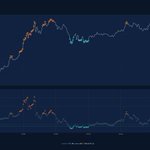
$ETH's 1-year RSI is sitting at the 12th percentile - historically a rare low reading.
Past instances have represented good long-term entry points, though it never feels that way in the moment.
Extreme readings like this historically haven't lasted long.
