

All my indicators can be found here: https://nitter.cf/t.co/Eerj9LjugX
Joined March 2026
- Tweets344
- Following333
- Followers680
- Likes1.4K


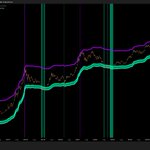


New creation: "Bitcoin Valuation Matrix"
A composite of 15 indicators such as on-chain metrics, moving average ratios and rolling returns, designed to identify Bitcoin's macro valuation extremes.
We are currently very close to the threshold.
Also, look at that wonderful trendline.

Long term holder NUPL is showing another bullish divergence, same as 2015 and 2023.
Open source script:
it.tradingview.com/script/Ax…


CVDD Bands are sitting right below price.
Before a long-term trend switch, a dip inside the oversold range (48k-58k) would be meaningful.
Open source script:
it.tradingview.com/script/eS…

Bitcoin Logarithmic Regression Quantile Bands just had the first bottom signal of this cycle.
Open source script:
it.tradingview.com/script/GU…

Sharpe Ratio Oscillator shows we are close to the cycle's bottom.
The indicator doesn't need another drop in price to fire a signal, it just needs TIME!
Open source script:
it.tradingview.com/script/2X…

SOPR Percentile Oscillator's trend is still deeply negative, while we are very close to getting another oversold signal.
The conjunction between another bottom formation and later the switch to a positive trend will confirm the start of the next bull run.
Open source script:
it.tradingview.com/script/Tg…

Stoch RSI Golden Cross is getting closer and closer.
Another drop in price would favour the crossover to happen in alignment with temporal projections in September/October.
Open source script:
it.tradingview.com/script/rA…

Whale Accumulation Index
This indicator measures the divergence between high value transactions' rate of change and price's rate of change.
Price is dropping while transactions made by big investors are rising, identifying a high value area of reversal.
Open source script:
it.tradingview.com/script/NB…

Miner Profitability Index had an extreme capitulation, reaching -4 sigma reading.
This indicates extreme stress on the miners, with very low profitability per unit of mining difficulty.
Open source script:
it.tradingview.com/script/UG…

Following a strong sell pressure by institutions in which Blackrock alone sold 50k Bitcoins in the last 30d, ETFs 14d and 30d average flows are deeply negative.

Aphelion means the furthest point from the sun.
It's an aggregate of 25 bottom indicators, displaying the ultimate buying opportunity.
We are currently 9% away from the line which sits at 55k$ per Bitcoin.

It looks like Bitcoin likes to bottom below previous cycle bottom's Volume Weighted Average Price (VWAP).
Price is currently fighting to stay above 2023 VWAP, I think a deviation below is to be expected.
Open source script:
it.tradingview.com/script/dH…

Thermocap Z-Score back in high value area.
Open source script:
it.tradingview.com/script/Tr…

"Ultimate Accumulation Season" back in high value area
54% of the indicators are now firing an accumulation signal

GLI vs BTC Cubic Regression z-score back in high value zone.
It's worth noting it is the first time price comes back in the oversold zone after firing a signal in the same cycle.
Script:
it.tradingview.com/script/vB…

GLI Weekly returns perfectly predicted this selloff.
This period of contraction is set to end in the middle of july.
Script:
it.tradingview.com/script/pT…


RSI on the Bitcoin/Gold ratio is back at oversold levels both on the daily and weekly timeframe.
The drop has been very fast.
This indicator shows relative strength index of Bitcoin compared to either Gold, Silver, S&P500 or the average of the three, on the weekly or daily timeframe.
Open source script:
it.tradingview.com/script/DX…


AHR999 now at 60k.
The more we drop from here the better.
A slight deviation below the base line would be amazing, making the bottom formation more similar to other cycles.
Indicator with open source script:
it.tradingview.com/script/mj…

BTC and the great decoupling from tech stocks.
While Bitcoin has strictly followed IGV's price action (iShares Tech Sector ETF) throughout all this cycle, now the correlation has diverged massively.
Bitcoin's rolling ratio normalized is dropping very fast, while IGV's ratio is at 100, the maximum level possible.
