

AtlasOnChain — Trading education Trading patterns daily Learn. Trade. Profit.
world 🌍
Joined January 2026
- Tweets3.5K
- Following384
- Followers6.6K
- Likes6.5K




AtlasOnChain retweeted

Golden cross: 50 MA crosses above the 200 MA.
Death cross: 50 MA crosses below the 200 MA.
Short-term MAs (5-8-13) show momentum shifts near key levels.
MAs lag.
They confirm what already happened.
A cross is context, not an entry.
Wait for structure.
Save this.

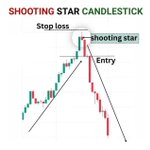
What Is A Shooting Star Candlestick?
A Shooting Star is a bearish reversal candlestick that forms after an uptrend.
It has three clear characteristics:
- A small body near the bottom of the candle
- A long upper wick
- Little to no lower wick
Price opens, rallies strongly during the session, then gets rejected and closes near the open (or lower). The longer the upper wick compared to the body, the stronger the rejection.
What the Shooting Star Tells You
It shows that buyers pushed price to a new high, but sellers stepped in aggressively and took control.
Higher prices were rejected. Demand dried up. Supply took over.
This is why the Shooting Star often marks the end of an uptrend (at least in the short term).
Key Rules for Validity
- It must appear after a clear upward move
- The next candle should ideally make a lower high and lower low (confirmation)
- A close back above the high of the Shooting Star invalidates the signal
- Works best at key resistance, overbought levels, or with confluence (RSI, moving averages, Fibonacci, supply zones)
How to Trade It
Entry:
On the next bearish candle after the Shooting Star (confirmation)
Stop Loss:
Above the high of the Shooting Star
Target:
Previous support, key structure levels, or a measured move based on the prior impulse
Important Context
A Shooting Star on its own is not enough.
It becomes high probability when it forms:
- At a clear resistance zone
- After an extended move
- With overbought conditions
- Alongside other confluence (order blocks, FVGs, liquidity grabs)
The pattern shows rejection.
Confluence shows whether that rejection has strength behind it.
Study the chart.
Wait for the close.
Then act only when structure supports the rejection.

AtlasOnChain retweeted
ICT Model 3: FVG + Breaker
Liquidity grab, then MSS.
Best entry: an FVG that lines up with a breaker block.
Shorts from premium. Longs from discount.
Stop beyond the sweep.
Target: the opposite liquidity.
Stacked zones, defined risk.
Save this.

🚨 MASTER THIS BEARISH ENTRY MODEL BEFORE YOUR NEXT TRADE:
There are 3 high-probability ways to enter a bearish move:
1. Break Block Reversal
Price sweeps liquidity → breaks structure (BOS) → rejects from the break block.
This is your earliest and sharpest entry.
2. Order Block Retest
After the initial break, price returns to the Order Block.
This is the cleanest and most common entry.
3. Supply Retest
Price comes back one more time into the higher supply zone before making the new low.
This is the safest but later entry.
Simple sequence most traders miss:
Liquidity Grab → Initial BOS → Break Block → OB Retest → Supply Retest → New Low
Study the chart carefully.
These three models appear almost every time smart money distributes.

Support breaks → Demand forms → Order Block holds
Price was ranging between clear Resistance and Support.
Then it broke below Support with strength.
That break created:
- A Demand Zone
- An Order Block just above it
Price later returned to the Order Block, respected it, and expanded higher.
Simple sequence:
1. Range
2. Break of Support
3. Demand + OB formation
4. Retest
5. Continuation
This is how clean structure + liquidity + Order Block confluence works.
AtlasOnChain retweeted
Rising Three Methods
A strong bullish candle.
Three small pullback candles stay inside its range.
A final bullish candle closes above the first candle's high.
It shows the trend is pausing, not reversing.
One pattern isn't a signal. Wait for the close.
Save this.

HOW TO USE THE 8:30am OPEN AND MIDNIGHT OPEN TOGETHER:
8:30am is the last ditch for Power of 3.
If Bullish:
If the midnight open is lower than where price is trading after 8:30 → Midnight open becomes less relevant. You work with the 8:30 open.
If Bearish:
If the midnight open is higher than where price is trading after 8:30 → Again, the 8:30 open takes priority.
Key Insight:
- Movement below the 8:30am open = Micro Judas Swing
→ This is building the low for the New York session.
- Movement below the Midnight open = Daily Judas Swing
→ This is building the low for the daily candle.
When price drops below both the 8:30 open and the Midnight open, you are in a deep discount.
This is often the ideal area to look for longs.
Reverse the logic for bearish scenarios.
Master the relationship between these two opens and your NY session bias becomes much clearer.

Find Daily Bias in 30 Seconds
Here’s the simple rule most traders overlook:
Scenario 1
Price sweeps previous day’s high and closes back below it.
→ Bearish. Expect continuation lower.
Scenario 2
Price sweeps previous day’s low and closes above previous day’s high.
→ Strong bullish signal. Look for buys the next day.
Scenario 3
Price sweeps both previous day’s high and low.
→ Liquidity taken from both sides. Stay out.
Scenario 4
Price doesn’t touch previous day’s high or low.
→ Inside bar. Wait for a clean breakout.
Scenario 5
Price sweeps previous day’s high and closes below previous day’s low.
→ Very strong bearish signal. Look for sells.
Master these five scenarios and you’ll stop guessing the daily bias.
ICT Entry Patterns
There are 4 core ways Smart Money enters after a structure shift:
1. SH → MSS with Quick RTO
(Risk entry right after the shift)
2. SH → MSS with Late RTO
(Waiting for deeper discount/premium)
3. SH + Confirmation Entry (Re-Entry) with Quick RTO
(Waiting for the first pullback into OB/FVG)
4. SH + Confirmation Entry (Re-Entry) with Late RTO
(Waiting for a deeper retest before entering)

Most traders lose money trading Market Structure Shifts.
Here’s why:
A shift without displacement is not a real shift.
You see:
• Liquidity swept
• Structure broken
• Fair Value Gap formed
It looks perfect…
You enter.
Stops below.
Targets above.
Then you get stopped out instantly.
Why?
There was no strong candle closing with momentum past the previous high or low.
No displacement = no real institutional intent.
Now look at a proper shift:
Liquidity swept.
Structure broken.
Strong candle closes above with clear displacement.
Leaves a clean FVG behind.
That’s the entry.
Stops below.
Target the next liquidity.
Rule to remember:
If there’s no displacement — it’s not a real shift.
This one filter alone will fix most of your failed setups.
One of the cleanest strategies:
Fibonacci + FVG + BOS
Here’s how it works:
1. Wait for a clear Break of Structure (BOS)
2. Price retraces into a Fair Value Gap
3. Use the 0.618 – 0.786 Fibonacci zone for confluence
4. Enter inside the FVG
5. Stop loss above the structure
6. Target the next liquidity pool

AtlasOnChain retweeted
Target
Take profit at the low-hanging fruit.
The next pool of liquidity in your direction:
equal highs/lows, or a nearby FVG.
Sweep, shift, enter on the FVG.
Target the nearest liquidity.
Save this.

What is a Dragonfly Doji?
A Dragonfly Doji is a single candlestick pattern that forms when the open, high, and close are all very close to each other (or the same), while the candle prints a long lower shadow.
This means sellers pushed price significantly lower during the session, but buyers stepped in strongly and drove it all the way back up to close near the high.
The long lower wick shows rejection of lower prices. The tiny body shows that by the end of the candle, the market had completely reversed the selling pressure.
When it matters most
A Dragonfly Doji carries the most weight when it appears after a clear downtrend, especially when price makes a new low and then fails to hold it.
It becomes even stronger when:
- It forms at a key support level or previous swing low
- Volume is elevated
- The close is in the upper portion of the candle’s range
How to trade it
1. Wait for the Dragonfly Doji to form after a down move
2. Look for confirmation (next candle closing higher or a break of the high)
3. Enter long
4. Place stop loss below the low of the Dragonfly
5. Target the next area of structure or liquidity above
The pattern itself is not a guarantee. It’s a signal that selling pressure has been absorbed and buyers are stepping in with strength.
Context + confirmation still matter more than the candle alone.
