

Let's turn complex information into powerful visuals // #dataviz // #infographics // #informationdesign // #workshops // since 2014 // by @Koen_VdE
Ghent, Belgium
Joined September 2014
- Tweets767
- Following233
- Followers646
- Likes265




Pinned Tweet
🎬 A new #dataviz project!

🥳 Hey tweeps, we've got a cool #dataviz project to share!
🎬 With @TheAcademy Oscars right around the corner, we created an interactive data visual showing all the vehicles ever used by @007 #JamesBond.
➡ Check it out at baryon.be/stories/jamesbond
(1/12)

2


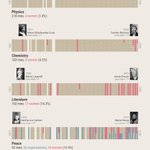
🏅 With the #NobelPrize2023 announcements this week, it's probably time to update our #WomenoftheNobelPrize #infographic.
Two new additions thus far, Katalin Karikó for Medicine and Anne L’Huillier for Physics!

5
360
💼 The @MAGYC_H2020 project studied how migration crises impact policy and governance.
📢To share their research results in an impactful way, we created a set of beautiful #infographics filled with insightful maps and #PowerfulCharts.
Find them at magyc.uliege.be/cms/c_780908… !
2
191
🤔 Can you use Excel to create a powerful chart?
Sure! Just make sure to step away from the default options...
youtu.be/m_ckfXjJo4w
174
🤓 We made a cool little #dataviz project!
🌍Population density for every country in the world, visualized as a ridgeline plot.
What does your country look like?
Check it out at baryon.be/stories/population…

📈 One of the most common pieces of #dataviz advice we give our clients is to use a small multiple approach.
📄 So to make it crystal clear how and why it works, we wrote a blog post about it: baryon.be/small-multiples-ca…
🔥 Let's build some #PowerfulCharts together!

1
169
❤️ I just love how our agency coach Thomas Joos summarized the essence of Baryon in a single sketch!
💪 We help you turn an audience that's falling asleep into an audience that's engaged and enlightened, using the power of crystal-clear visuals.
(1/2)

1
260
🎯 In this way, we help unlock knowledge that might otherwise be lost. That's our mission.
✅ If you want to know how we can help your organization, team or research group with powerful #datavisualization, #infographics or interactive #reports, visit baryon.be/all-services !
87
💡 If you read only 1 thing today, make it this:
"Connected Scatterplots Make Me Feel Dumb" by @nickdesb
About the joys & downsides of connected scatterplots (we've made a few ourselves), but more importantly about what makes a chart easy to understand.
nightingaledvs.com/connected…

4
232
Charts in the wild!
Can you spot the problem? 😉
(EN: average body length for different professions)

211
📊 "Powerful data visualization will be key to make great products stand out from the competition."
A compelling quote from one of our clients in an energizing meeting yesterday. We love working with founders who believe in the value and potential of #datavisualization.
(1/2)

1
1
216
Great design and UX is what differentiated Apple from its competition. Great #dataviz, #informationdesign and data UX is what can differentiate an ambitious startup from its competitors.
Do you agree?
(2/2)
88
🚀 The fastest way to create more #PowerfulCharts: a single line break.
👏 Don't let your tool decide where the first line of your title ends, and the second one begins. Choose your line breaks carefully, and keep the important words together.
#informationdesign #dataviz

2
305
🏄♂️🏄♂️🏄♂️🏄♀️🏄♀️ No serious #dataviz post today, because our team is out enjoying a teambuilding!
🩳 Want to join us next year? Why not check out baryon.be/jobs?
We're looking for a 🧑🏫 (freelance) trainer and an experienced 📊 information designer.
#informationdesign #jobs

2
221
👩🎓 Friday afternoon is knowledge update time! Our information designer Sofia read @ChristiansenJen's magnificent 'Building Science Graphics', and is sharing its key insights with the rest of our team!
#informationdesign #infographics
150
🔥 The story of our founder Koen explains the WHY of Baryon: we create powerful visuals to avoid the loss of knowledge. To turn confusing information into insights that enlighten and engage.
🔥 I was challenged twice today, with the same question. What drives you? Why are you building Baryon?
💡 The answer is KNOWLEDGE.
(1/5)
1
194
🔥 A heat map table is a powerful chart type. It combines the big picture with completeness, which is rare in the world of #dataviz.
#datavisualization #informationdesign
(1/4)

1
2
356


🥳 Today we are joined by Pavel, a bachelor in mathematics at Ghent University. He will assist us at @BaryonDesign with data analysis and will be trained as an information designer.
🧗♂️ Besides data he is very adventurous, and he speaks quite a bit of Chinese!

1
233
❤️ Excellent #informationdesign or #dataviz is not only beneficial for your audience.
😊 Showing crystal-clear and effective visuals will also boost your confidence and energy while you are presenting your insights!
