

Full-time crypto trader & investor since 2017
Joined November 2020
- Tweets4.6K
- Following470
- Followers34.2K
- Likes10.4K





$BTC's current bottom is 14–16 weeks earlier than the bottoms of the prior two bear markets


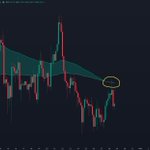
$BTC rejected at the HyperTrend resistance
FOMC in the next few minutes as well
Live on YouTube right now: youtube.com/live/zuzikALzKKo

$BTC has moved higher in the days and weeks following each of the last two FOMC meetings


$BTC was higher a year later in all 4 previous cases where it reclaimed the 50-week MA

$BTC is once again trading at the Golden Pocket
Live on YouTube right now: youtube.com/live/lj-b7Ks9Zg0

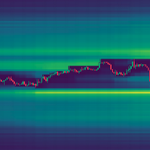
$BTC has a major liquidation cluster just below the current price and another above the recent highs at $85,000


$BTC stayed above the 50-week MA for over 950 days after breaking above it in the previous cycle

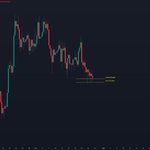
$BTC is nicely holding the Golden Pocket support
Live on yt right now: youtube.com/live/bqNgFa-LkJg

$BTC could bottom after two consecutive red 6-month candles for the third bear market in a row

$BTC now has nearly 3.5x more liquidations above than below
$10,450,000,000 short liquidations to the upside
$3,000,000,000 long liquidations to the downside

$BTC bottomed in the previous bear market after the weekly RSI dropped below 30 and formed a bullish divergence, making a higher low while price made a lower low

$BTC has historically formed major bottoms whenever MVRV was near the lower end of its cycle range

$BTC dominance fell roughly 46% the last time the 50-week MA crossed below the 100-week MA


$BTC has a major liquidation cluster building just above the recent high at $85,000
