

Most investors look too late. I track where capital moves first. Systematic rankings across 1300+ mining & resource stocks.
Joined April 2022
- Tweets7.8K
- Following172
- Followers9.8K
- Likes41.7K
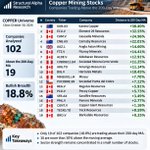





🚨 COPPER MINING STOCKS | ONLY 18.8% REMAIN ABOVE THEIR 200-DAY MOVING AVERAGE
Market breadth across the copper mining sector has deteriorated dramatically.
📊 Percentage of companies trading above their 200-day moving average (MA200):
• August 21: 71.3%
• September 25: 60.4%
• October 2: 51.5%
• October 16: 38.2%
• October 23: 22.8%
• October 30: 18.8%
Of the 102 companies analyzed, only 19 of the 101 with valid MA200 data are still trading above their 200-day moving average.
🔎 THE 19 STOCKS STILL HOLDING ABOVE THEIR MA200
Percentage distance above the MA200, ranked from strongest to weakest:
🇦🇺 Kantra Copper (KAN.AX) +38.40%
🇨🇦 Element 29 Resources (ECU.V) +32.55%
🇨🇦 Cascadia Minerals (CAM.V) +24.96%
🇦🇺 Carnaby Resources (CNB.AX) +22.01%
🇬🇧 Anglo Asian Mining (AAZ.L) +14.60%
🇨🇦 Fitzroy Minerals (FTZ.V) +14.41%
🇨🇦 Aldebaran Resources (ALDE.V) +12.91%
🇵🇪 Cerro Verde (CVERDEC1.LM) +11.25%
🇨🇦 Amerigo Resources (ARG.TO) +11.14%
🇨🇦 Hercules Metals (BIG.V) +10.45%
🇵🇪 Minsur (MINSURI1.LM) +7.70%
🇨🇱 Punta del Cobre (PUCOBRE.SN) +7.12%
🇨🇦 Regulus Resources (REG.V) +5.91%
🇨🇦 Pecoy Copper (PCU.V) +5.73%
🇦🇺 Sandfire Resources (SFR.AX) +3.49%
🇨🇦 Panoro Minerals (PML.V) +2.77%
🇨🇦 Copper Giant Resources (CGNT.V) +1.16%
🇨🇦 Teck Resources (TECKb.TO) +0.59%
🇨🇦 Barksdale Resources (BRO.V) +0.25%
📉 WHAT DOES RECENT HISTORY TELL US?
Back in August, more than 7 out of 10 copper mining stocks were trading above their MA200.
Today, fewer than 2 out of 10 remain above it.
Market breadth has collapsed by 52.5 percentage points in just ten weeks.
And the underlying picture is even more fragile than the headline number suggests: several of the 19 remaining stocks are barely holding above their moving averages.
This correction is no longer confined to a handful of companies. It has spread across virtually the entire sector.
Historically, the current 18.8% reading is the lowest of 2026, although our weekly data going back to October 2023 show even weaker readings, including 14.4% in 2023.
Such severely depressed breadth can create the conditions for a rebound, but it does not, by itself, confirm a market bottom.
What I want to see now is a sustained improvement in bullish participation. Until then, the sector's underlying structure remains weak.
Structural Alpha Research | Data as of October 30, 2026
#Copper #MiningStocks #MarketBreadth

📌 A quick clarification: The 102 copper mining companies in this analysis come from the combined holdings of the Global X Copper Miners ETF ($COPX) and the Sprott Junior Copper Miners ETF ($COPJ).
This gives us exposure to both established copper producers and smaller exploration and development companies, providing a broader picture of market breadth across the sector.
🚨 ENERGY: THE SAME WARNING THAT PRECEDED COPPER'S CORRECTION IS NOW FLASHING IN ENERGY.
And this time, the warning may be appearing BEFORE the rally is even over.
Look closely at these two charts.
🔴 COPPER MINERS ($COPX / $COPJ): A double bearish divergence between price and the percentage of stocks above their 200-day moving average preceded a sharp correction, which I interpret as Wave C.
🟡 ENERGY ($XLE): A strikingly similar double bearish divergence is developing as the sector approaches what could be the final stage of Wave 5.
XLE keeps pushing toward new highs. But fewer stocks are supporting the advance.
And here's what makes this particularly concerning:
The divergence remains intact even after expanding our ENERGY universe by 28 companies.
Only 68.88% of energy stocks are above their 200-day moving average.
And just 6.63% are trading above their previous 250-day highs.
The price is making new highs. The sector's internal strength is not.
My base case is NOT an imminent upside breakout in energy stocks or crude oil.
I'm expecting a major correction across the energy sector.
The top isn't confirmed. But market breadth is sending a warning that I believe deserves serious attention.
Copper has already shown us what can happen when price and breadth diverge.
Is energy next?
#Energy #XLE #Oil #Copper #MarketBreadth

🚨 GOLD MINERS: ONLY 15 STOCKS STILL STANDING ABOVE MA200
The deterioration in gold-mining stocks is remarkable.
Our latest quantitative analysis of the $GDX– $GDXJ universe reveals that just 15 of 146 securities (10.27%) remain above their 200-day moving average.
📉 Nearly 90% are trading below this key long-term trend indicator.
🔎 WE HAVE IDENTIFIED THE 15 SURVIVORS:
🇦🇺 Benz Mining (BNZ.AX) +37.72%
🇨🇦 Liberty Gold (LGD.TO) +24.61%
🇨🇦 Mineros (MSA.TO) +22.12%
🇦🇺 Aurelia Metals (AMI.AX) +18.76%
🇦🇺 Turaco Gold (TCG.AX) +15.06%
🇨🇦 Aya Gold & Silver (AYA.TO) +11.22%
🇦🇺 Northern Star (NST.AX) +9.86%
🇺🇸 Vista Gold ($VGZ) +9.58%
🇨🇦 Apex Mining ($APX.V) +7.90%
🇺🇸 Centerra Gold ($CGAU) +6.55%
🇦🇺 Perseus Mining (PRU.AX) +3.52%
🇦🇺 Vault Minerals (VAU.AX) +2.94%
🇦🇺 Minerals 260 (MI6.AX) +2.65%
🇨🇦 Banyan Gold ($BYN.V) +1.85%
🇦🇺 West African Resources (WAF.AX) +0.10%
These stocks have retained their position above MA200 while the overwhelming majority of the universe has fallen below it.
Does this mean the sector is approaching a bottom?
Possibly, but extreme weakness alone is not confirmation.
The real question is whether these remaining pockets of relative strength can hold up, and whether market breadth begins to recover.
📊 Structural Alpha Research
Independent Quantitative Market Research
Full GDX–GDXJ analysis coming soon.
#GoldMiners #GDX #GDXJ #MarketBreadth
🥈SILVER | A Strong Rebound Ahead, but One Final Shakeout May Follow
Silver is approaching a potentially decisive turning point.
After a prolonged correction within a descending channel, prices are testing its lower boundary, while momentum indicators are reaching deeply oversold levels.
📈 My base case is a strong short-term technical rebound. I believe much of the downside potential has already been exhausted.
However, I do not think the correction is necessarily over.
⚠️ The main risk comes from GOLD.
Gold closed the week below the critical $3,950 level, opening the door to further weakness:
• $3,800: First downside target.
• $3,650: Next potential target if $3,800 fails.
My expected sequence for silver:
1️⃣ A strong rebound in the near term, supported by stretched technical conditions and proximity to the lower boundary of its descending channel.
2️⃣ One final downward shakeout, potentially triggered by further weakness in gold, taking silver slightly below Friday's $48.90 low.
3️⃣ A deeper decline toward $45.50–$46.00 is possible if gold breaks below $3,800. This is silver's critical support zone, but reaching it is not my base case.
Bottom line: I believe silver is approaching the final stages of its correction. The immediate outlook favors a significant technical rebound, but a subsequent retest—or marginal break—of Friday's lows remains possible before a more sustainable recovery develops.
The key variable is gold.
#Silver #Gold #PreciousMetals #XAGUSD #XAUUSD

🚨 JUNIOR MINERS | 56 STOCKS STILL STANDING
The junior mining sector has suffered a brutal correction.
Our latest quantitative analysis of 477 mining securities reveals just how severe the damage has become:
📉 Only 56 of 471 stocks with valid data (11.89%) remain above their 200-day moving average.
📉 Median weekly return: −4.35%
📉 Median 52-week drawdown: −50.00%
📉 344 of 477 stocks declined last week.
But here's what makes this study particularly interesting:
🔎 WE HAVE IDENTIFIED ALL 56 STOCKS STILL TRADING ABOVE THEIR 200-DAY MOVING AVERAGE.
While nearly 9 out of 10 securities have fallen below this key long-term trend indicator, these 56 have managed to remain above it.
Not all are showing positive short-term momentum, and relative strength is not a guarantee of future performance. But identifying the securities that are holding up in such a deeply damaged market is an important starting point for further research.
The complete list of 56 securities is now available on our website, including:
• Company names and tickers
• Distance above the 200-day moving average
• Weekly performance
• Four-week performance
• Year-to-date returns
We've also published the complete interactive ranking of all 477 securities, with searchable and sortable data.
The question now is whether these 56 survivors can maintain their relative strength — and whether broader market participation will eventually recover.
📊 Explore the full research and all 56 names:
🔗 structuralalpharesearch.net/…
Independent quantitative market research.
#JuniorMiners #GoldStocks #MiningStocks #MarketBreadth

🚨 SIL–SILJ | Silver Miners: Breadth Collapses to Multi-Year Lows
Our latest quantitative study of 98 securities reveals an extraordinary deterioration in market participation.
📉 Only 6 of 97 securities (6.2%) remain above their 200-day moving average:
- Minera Frisco (MFRISCOA1.MX)
- Sailfish Royalty ($FISH.V)
- Liberty Gold (LGD.TO)
- Aya Gold & Silver (AYA.TO)
- Sandfire Resources (SFR.AX)
- Panoro Minerals ($PML.V)
📊 Median 52-week drawdown: −46.9%
🔴 79 of 98 securities declined this week.
📉 Only 4 securities show a positive 20-day signed-volume balance.
The historical comparison is striking: breadth has fallen to levels last seen around October 2023, during the final phase of the previous bear market.
Could such extreme weakness precede a major bottom? Possibly. But a breadth extreme is not confirmation of a reversal.
🔎 Explore our complete research, original technical chart and interactive rankings of all 98 securities, including weekly, 4-week, 3-month and YTD returns.
👉 structuralalpharesearch.net/…
#Silver #SilverMiners #SIL #SILJ

⚡ ENERGY STOCKS: ONE OF THE STRONGEST MARKET STRUCTURES RIGHT NOW
While much of the mining sector remains under pressure, energy stocks are telling a very different story.
Our latest quantitative study examines 169 energy-related securities, looking beyond headline index performance to measure market breadth, relative strength, trading volume, and drawdowns.
And the results are striking.
📊 70.4% of the universe trades above its 200-day moving average — the strongest reading among the 12 market universes we track.
📈 Market breadth has improved for four consecutive weeks, gaining 13 percentage points over the past month.
💪 113 of 169 securities advanced during the latest week, with a median return of +1.28%.
📉 The median drawdown from 52-week highs stands at just −8.44%, considerably smaller than those observed across mining universes.
🔎 WHAT DO THESE NUMBERS TELL US?
Energy's strength is not confined to a handful of large-cap companies.
Participation is broadening, directional volume indicators are improving, and the sector continues to demonstrate relative resilience.
This does not guarantee further gains, but it suggests that energy currently has one of the healthiest underlying market structures in our research universe.
🏆 THE MOST INTERESTING PART: THE COMPLETE RANKING
Which energy stocks are actually leading?
Which companies have delivered the strongest returns over the past week, four weeks, three months, and year to date?
And which apparent weekly winners are still lagging over longer periods?
We've published the complete interactive ranking of all 169 securities, including:
• Weekly and global rankings
• Latest closing prices
• 1-week, 4-week, 3-month, and YTD returns
• Searchable, sortable company-level data
No cherry-picked winners. The entire universe is available for comparison.
🔗 Explore the full research and discover where the real leadership is emerging:
structuralalpharesearch.net/…
#EnergyStocks #MarketBreadth #QuantitativeResearch

⚠️ AN IMPORTANT CAUTION ON ENERGY
Despite the sector's strong relative performance and improving breadth over the past four weeks, a significant divergence remains unresolved.
📈 XLE is making new highs.
📉 Yet only 70.4% of our ENERGY universe trades above its 200-day moving average, well below the roughly 90% reached in March.
The volume-breadth indicator is also failing to confirm the latest price highs.
The key distinction: short-term breadth is recovering, but medium-term participation has not confirmed the rally.
This is not necessarily a sell signal, but it is a warning worth monitoring.
We've added the original technical chart and a detailed discussion of this divergence to the full study:
structuralalpharesearch.net/…

🌍 GLOBAL MARKETS | TWO VERY DIFFERENT REALITIES
Our latest analysis of 12 market universes reveals a striking divergence.
70.4% of energy stocks trade above their 200-day moving average.
58.9% of S&P 500 stocks do too.
But across all eight mining universes, participation remains below 20%.
Some markets are recovering. Others remain structurally devastated.
The real story isn't where prices bounced. It's where market strength is actually returning.
Full 12-universe analysis:
structuralalpharesearch.net/…
#GlobalMarkets #MarketBreadth #QuantitativeResearch

🚨 SILVER FUTURES | A MAJOR BREAKOUT MAY BE APPROACHING
Silver is approaching a potentially decisive technical turning point.
A well-defined descending wedge is nearing its apex, with declining volume — a characteristic often seen in contracting consolidation patterns.
Price is now testing a major support zone around $48–50, while momentum indicators are deeply oversold.
My interpretation: The correction may be approaching its final stage. If support holds, a bullish reversal could develop, with a breakout above descending resistance providing stronger confirmation.
The setup is compelling. The breakout is not yet confirmed.
#Silver #XAGUSD #TechnicalAnalysis

🇦🇺 AUSTRALIAN MINING STOCKS | THE START OF A RECOVERY OR JUST A REBOUND?
Australian mining stocks have staged a substantial recovery this week. But there's something beneath the surface that should make us cautious.
📈 72.7% of the companies gained this week.
Yet only 19.3% are trading above their 200-day moving average, and the median drawdown from 52-week highs remains at 39.7%.
This is the market's central contradiction: prices are rebounding sharply, but the underlying market structure remains severely damaged.
Are we seeing the first signs of a sustainable recovery, or merely a rebound within a broader downtrend?
My conclusion: The rebound is significant, but there is still insufficient evidence to confirm a trend reversal. A sustainable recovery will require a sustained improvement in market breadth and more convincing buying participation. For now, prices have responded, but the underlying market structure remains weak.
I've analyzed 88 Australian mining companies, examining market breadth, volume, drawdowns, and relative strength.
📊 Full analysis and interactive ranking of all 88 companies:structuralalpharesearch.net/…
#ASX #MiningStocks #MarketBreadth

🚨 SILVER | ARE WE ON THE VERGE OF AN EXPLOSIVE REVERSAL?
My base-case scenario is that silver will likely establish the low of this correction tomorrow, Friday, October 30, potentially in the $48.50–$49.00 range for December silver futures.
The chart still shows a clearly bearish corrective structure, with deteriorating momentum and no definitive reversal signal yet. However, I believe we may be approaching a major turning point.
Something particularly interesting has caught my attention: some of the hardest-hit mining stocks are already forming small reversal patterns. These are still early signals, but they could be pointing to an important shift in market behavior.
If my interpretation is correct, what comes next may not be a slow, orderly recovery. Instead, we could see a powerful, rapid rebound that catches many investors completely off guard.
And what happens after that?
It's entirely possible that, following the initial surge, silver and the mining sector will retest the correction lows. But it's equally possible that they won't.
Anyone familiar with this sector knows how explosive recoveries can be. When precious metals and mining stocks decide to reclaim lost ground, they can move with extraordinary speed, leaving behind those waiting for a second chance to get in.
This scenario still requires confirmation. The $48.50–$49.00 area is my reference zone for a potential bottom, not a certainty.
My assessment is that we're much closer to the end of this correction than to its beginning.
#Silver #SilverMiners #PreciousMetals

If the pattern completes as expected, I anticipate a powerful upside reversal next week, followed eventually by a possible retest of the breakout area. The next few trading sessions could be decisive. Let's see whether the market confirms this scenario. #Silver #PreciousMetals #TechnicalAnalysis

THE HARDEST PART OF A BULL MARKET ISN'T THE DECLINE. IT'S THE WAITING.
At first, investors welcome the correction. They see it as an opportunity.
A few weeks later, they become impatient.
After several months, frustration takes over. Confidence fades. Every failed rally feels like confirmation that something is fundamentally wrong.
And eventually, many investors stop believing in the very trend they were so confident about.
That's what prolonged corrections do.
They don't just reduce portfolio values. They wear down conviction, patience, and the ability to maintain perspective.
A bull market doesn't need to end to make investors feel defeated.
And sometimes, the most difficult part of investing is simply enduring the period between being right about the bigger picture and seeing the market reflect it.
#Gold #Silver #MiningStocks #InvestingPsychology

🇦🇺 ASX MINERS: UP 167% — BUT 40% BELOW THEIR PEAKS
An analysis of 82 ASX-listed mining companies from February 29, 2024, to October 27, 2026
A powerful bull market beneath a severe correction
Australian mining stocks have delivered exceptional cumulative returns since February 2024. Across a sample of 82 ASX-listed companies, the median return reached +166.66%, with 75 companies (91.46%) recording positive returns over the period.
Yet these impressive gains conceal substantial losses from the highs reached during the advance.
The median maximum drawdown was −53.54%, while the median drawdown at the end of the study was −40.16%. Of the 82 companies, 59 (71.95%) were trading at least 30% below their respective peaks, and 29 (35.37%) were at least 50% below those peaks.
These figures illustrate a defining characteristic of the mining equity cycle: extraordinary long-term appreciation can coexist with severe intermediate corrections.
Extraordinary winners
Several companies generated exceptional returns during the period:
- Benz Mining+3,159.26% - Solstice Minerals+2,100.00% - Forrestania Resources+1,352.38% - Asara Resources+1,177.78% - Focus Minerals+936.36%
These results demonstrate the magnitude of the opportunities created during the advance. They should not, however, be mistaken for the performance of the typical company: the distribution of returns is highly dispersed.
The collapse in market breadth
The most striking development occurred in the technical condition of the market.
On August 28, 2026, 89.01% of the companies covered by the breadth indicator were trading above their 50-session moving averages.
By September 30, that proportion had declined to 47.19%. It fell further to 21.59% on October 9 and reached just 1.14% on October 23.
At the October 27 close, only 3.49% remained above their 50-session averages, while 16.28% were above their 200-session averages.
The deterioration was therefore not confined to a single trading session. It developed over several weeks before reaching exceptionally depressed levels in late October.
Signs of stabilization, not yet recovery
Some short-term indicators improved following October 23.
The proportion of companies above their 20-session moving averages rose from 2.27% on October 23 to 8.14% on October 27.
The proportion registering new 250-session closing lows, according to the supplied market-breadth series, also declined sharply, from 17.24% on October 23 to 1.18% on October 27.
These developments suggest an easing of immediate selling pressure. They do not, by themselves, establish that a durable market bottom has formed.
With fewer than 4% of companies above their 50-session moving averages, broad-based technical recovery remains absent.
A revealing contrast
The central finding is the coexistence of two apparently contradictory realities.
Since February 2024, the median Australian mining stock in this sample has appreciated by approximately 167%. Yet by late October 2026, the median stock was also trading approximately 40% below its own peak.
Long-term returns describe the strength of the preceding advance. Drawdowns and market breadth reveal the severity of the subsequent correction.
Both perspectives are necessary to understand the market.
Conclusion
The Australian mining equity market has produced exceptional opportunities during the current cycle, but its technical deterioration has been widespread and severe.
The collapse in market breadth provides evidence of a correction extending far beyond a handful of underperforming companies.
Whether the late-October stabilization develops into a sustained recovery remains an open question. A more convincing improvement would require broader participation, particularly a sustained increase in the proportion of companies trading above their 50-session moving averages.
For now, the evidence supports a clear conclusion: extraordinary cumulative gains have been accompanied by a remarkably deep and widespread correction.
Methodological notes
The cumulative-return and drawdown analysis covers 82 ASX-listed mining companies with sufficient historical observations for the period beginning February 29, 2024, and ending October 27, 2026. Eight additional companies were excluded under the ranking's eligibility criteria.
Returns are measured using the first eligible closing price and the final closing price. Drawdowns are calculated from each company's historical closing-price peaks within the study period.


📊 Complexity Is Not Predictive Power.
We examined the percentage of stocks with rising 200-day moving averages across 12 market universes.
Key conclusions:
• Extreme breadth weakness does not necessarily signal a market bottom.
• The indicator's structural lag limits its ability to identify early reversals.
• Sophistication does not establish a predictive edge.
A precise measurement of market conditions is not necessarily a forecast.
Read the full research:
structuralalpharesearch.net/…
#QuantResearch #MarketBreadth #StructuralAlpha

JUNIOR MINING STOCK RETURNS SINCE THE FEBRUARY 29, 2024 BULL MARKET BEGAN: EXTRAORDINARY GAINS AND DEVASTATING DRAWDOWNS
A historical study of 452 junior mining companies | February 29, 2024 – October 26, 2026
Structural Alpha Research
452 mining companies. Nearly three years of historical data. Extraordinary cumulative gains — and an equally extraordinary collapse in market breadth.
The junior mining sector is experiencing one of the most severe periods of technical deterioration in our historical study.
Yet the data reveal a striking paradox.
Almost three out of four junior mining companies remain in positive territory since February 2024, even though the median stock has fallen more than 50% from its individual high.
How can a market generate exceptional long-term returns while suffering such a devastating correction?
Our study of 452 junior mining companies, covering February 29, 2024 through October 26, 2026, examines cumulative performance, drawdowns, moving-average participation, new lows and relative strength.
The results offer a revealing picture of the sector's internal condition.
1. THE BULL MARKET IS STILL VISIBLE IN HISTORICAL RETURNS
Despite the recent selloff, the cumulative performance of the universe remains remarkable.
Of the 452 companies analyzed:
334 companies (73.9%) have positive cumulative returns.
112 companies (24.8%) have negative returns.
6 companies (1.3%) are essentially unchanged.
The median cumulative return stands at +127.27%.
In other words, the company at the center of the distribution has more than doubled its initial share price.
This is not the profile of a universe that has failed to generate wealth over the full study period.
But cumulative returns tell only part of the story.
They do not reveal how much of those gains has subsequently disappeared.
2. THE OTHER SIDE OF THE RALLY: DEVASTATING DRAWDOWNS
The drawdown statistics are among the most striking findings of the study.
Median maximum drawdown: −61.49%
Median current drawdown: −51.31%
Companies currently down from their highs:
At least 30%: 367 companies.
At least 40%: 311 companies.
At least 50%: 240 companies.
At least 60%: 160 companies.
More than half of the universe is trading at least 50% below its individual high during the study period.
Consider the contrast:
Median cumulative return: +127.27%.
Median current drawdown: −51.31%.
Both figures describe the same group of companies.
A market can retain extraordinary gains over a multiyear period while simultaneously undergoing a correction of exceptional severity.
These are not contradictory observations. They reveal the extreme volatility and dispersion characteristic of junior mining equities.
Importantly, these are cross-sectional company statistics, not the performance of an investable equal-weighted index.
3. MARKET BREADTH REVEALS THE EXTENT OF THE DAMAGE
To understand the current condition of the sector, we need to look beyond cumulative returns.
Market breadth measures how many companies are actually participating in a trend.
And the deterioration has been dramatic.
Participation above the 200-day moving average
On August 28, 50.23% of companies with sufficient data traded above their 200-session moving average.
By October 23, that figure had collapsed to 17.56%.
On October 26, it recovered only marginally to 17.75%.
That represents a decline of more than 32 percentage points in less than two months.
The weakness is no longer confined to a limited group of underperforming stocks.
It has spread across the vast majority of the universe.
Participation above the 50-day moving average
The deterioration is even more severe in the intermediate trend.
On August 28, 78.14% of companies traded above their 50-session moving average.
By October 23, participation had fallen to just 6.83%.
On October 26, it improved slightly to 7.67%.
Fewer than eight out of every hundred companies were above their 50-day moving average.
This is not an ordinary deterioration in momentum. It is an exceptionally broad breakdown in trend participation.
The simultaneous weakness of the 50-day and 200-day measures indicates that both intermediate- and longer-term technical structures have been severely damaged.
4. NEW LOWS CONFIRM THE INTENSITY OF SELLING PRESSURE
Moving averages are only one dimension of market breadth.
New lows provide another important perspective.
On October 23:
40.00% of companies with valid data recorded new 20-session closing lows.
9.51% recorded new 52-week closing lows.
By October 26, those percentages had declined to:
26.38% for 20-session lows.
6.95% for 52-week lows.
The decline in short-term new lows was substantial: 13.62 percentage points in a single session.
However, the distinction between short-term and long-term new lows is crucial.
A surge in 20-day lows can reflect a sharp liquidation event.
A significant expansion in 52-week lows suggests something more persistent: companies are breaking price levels that had held for approximately an entire trading year.
The current correction therefore involves not only intense selling pressure, but also significant deterioration in longer-term price structures.
5. IS A BULLISH BREADTH DIVERGENCE DEVELOPING?
This is perhaps the most important question.
After such an extreme deterioration, investors naturally begin looking for evidence that selling pressure is exhausting itself.
Bullish breadth divergences typically emerge when the market continues to register new price lows, but progressively fewer companies participate in that move.
The internal market begins to improve before the broader recovery becomes obvious.
The October 26 readings offer some preliminary encouragement.
Compared with October 23:
MA200 participation improved from 17.56% to 17.75%.
MA50 participation improved from 6.83% to 7.67%.
New 20-session lows declined from 40.00% to 26.38%.
New 52-week lows declined from 9.51% to 6.95%.
These are favorable developments.
But they represent only one session.
There is not yet sufficient evidence to declare a confirmed bullish breadth divergence.
A durable improvement would require a sustained contraction in new lows, broader participation above moving averages and evidence that the market can maintain its recovery.
An isolated rebound after an extreme selloff is not the same as a structural reversal.
6. RELATIVE STRENGTH: THE NEXT LEADERS MAY ALREADY BE DIFFERENT
One of the defining characteristics of junior mining equities is the enormous dispersion between individual companies.
Some stocks have multiplied their prices many times over since February 2024.
Others have suffered catastrophic losses.
Even among the strongest cumulative performers, the ability to preserve gains varies dramatically.
For example:
San Lorenzo Gold has accumulated a gain exceeding 7,600%, with a current drawdown of approximately 24%.
Patagonia Gold retains a cumulative gain exceeding 2,100%, but its current drawdown exceeds 74%.
Discovery Silver combines a cumulative gain above 1,500% with a current drawdown of approximately 24%.
These examples illustrate an important distinction.
Historical leadership is not necessarily the same as current resilience.
A company may rank among the greatest winners of a bull-market cycle while simultaneously experiencing an exceptionally severe correction.
Relative strength should therefore be evaluated through both cumulative performance and the ability to withstand market-wide selling pressure.
And as market conditions change, leadership may rotate.
The companies that dominated the previous advance will not necessarily lead the next recovery.
7. CORRECTION WITHIN A BULL MARKET — OR THE BEGINNING OF A BEAR MARKET?
The evidence supports two plausible scenarios.
The recovery scenario
The current decline could represent an extreme liquidation phase within a longer-term bull market.
Under this scenario, new lows would progressively contract, participation above moving averages would recover, and a smaller group of resilient companies could begin establishing new leadership.
Breadth improvement might emerge before the broader price recovery becomes convincing.
The prolonged deterioration scenario
Alternatively, the correction could continue eroding the substantial gains accumulated since February 2024.
Initial rebounds might fail to restore intermediate-term trends.
Participation could remain depressed, while persistent 52-week lows would indicate further deterioration in long-term structures.
At present, the data do not allow either scenario to be ruled out.
The decisive factor will not simply be how far prices have already fallen.
It will be whether the market's internal condition begins to improve consistently.
8. WHAT WE ARE WATCHING NEXT
Five indicators will be particularly important over the coming weeks:
50-day moving-average participation: Is the intermediate trend beginning to recover?
200-day moving-average participation: Are longer-term structures being rebuilt?
20-session new lows: Is immediate selling pressure losing breadth?
52-week new lows: Is longer-term technical deterioration beginning to subside?
Relative strength: Which companies are demonstrating resilience and emerging leadership?
No single indicator is sufficient.
The strongest evidence would come from several measures improving together and sustaining that improvement.
THE CENTRAL CONCLUSION
Our study of 452 junior mining companies reveals five essential findings.
First: The cycle since February 2024 has generated extraordinary cumulative gains. Nearly 74% of companies remain positive, and the median cumulative return exceeds 127%.
Second: The correction has been devastating. The median current drawdown exceeds 51%, and more than half the universe has lost at least half its value from individual highs.
Third: Technical deterioration is extraordinarily widespread. Participation above both the 50-day and 200-day moving averages has collapsed.
Fourth: Selling pressure is affecting longer-term structures, as shown by the expansion in 52-week lows.
Fifth: The October 26 improvement is encouraging, but it does not yet constitute a confirmed bullish divergence.
The distinction matters.
Extreme oversold conditions describe the magnitude of a decline. They do not, by themselves, prove that the decline has ended.
The most important signal will not merely be that junior mining stocks stop falling.
It will be that market breadth begins to improve persistently.
Until then, analytical caution remains essential.
READ THE COMPLETE RESEARCH
The full study includes detailed historical breadth statistics, moving-average participation tables, new-low analysis, relative-strength comparisons, methodology and an interactive ranking of all 452 junior mining companies, including cumulative returns and maximum and current drawdowns.
Structural Alpha Research — Full Study:
structuralalpharesearch.net/…
Independent quantitative research. For informational purposes only. Not investment advice.
#JuniorMiners #GoldStocks #SilverStocks #MiningStocks #MarketBreadth #Drawdown #RelativeStrength


