

I trade BTC for a living
$BTC
Joined June 2023
- Tweets18.5K
- Following18
- Followers8.1K
- Likes9.1K





$BTC
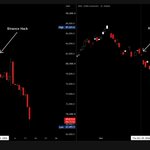
Triangle on the chart. Range getting tighter.
Tricky PA.
Possible fake out to the upside at 66k, mainly watching for a sweep of the 62k weekend lows before any real move up.
If it sweeps and reclaims, late shorts get trapped.
Nvidia earnings tonight could be the trigger.

4
19
1,152
$BTC
If you’re waiting for the next leg up, here’s the timeline.
The last two moves like this took an average of 66 days to break bullish.
Once price broke above the daily 20 and 50 SMA, it ran to new range highs within 4-6 weeks.
This suggests we range until late December or early January, then push higher from there.

$BTC
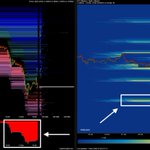
Bears took almost all the liquidity below.
What’s left is above: -20B in short liquidation delta.
This week:
Tuesday ➜ Nvidia earnings
Thursday ➜ Anthropic IPO
A strong AI week could flip this fast.

11
56
5,233
$BTC
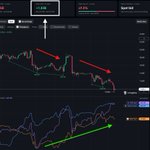
3 straight days of selling, and daily indicators are deeply oversold.
Heavy selling like this on a weekend is highly unusual.
Something is up.
Areas to watch: 👇
1 month liquidity bottom is 64k.
August lows at ~62.3k (possible support).
No bottom until buyers step in to defend.

$BTC / $NVDA
October 29 might be THE MOST important day of this correction, and most people missed why...
Two of the biggest stories in crypto and AI broke within hours of each other.
🔶 Crypto: Binance hacked
• $6.3B drained, most of it in about 20 minutes
• The largest crypto theft on record
• Withdrawals paused, BTC dropped ~5% from 81.5k
• FBI blames North Korea. Binance says it will cover 90% of losses.
🟢 AI: Nvidia’s CEO linked to a Chinese spy allegation
• Same day, the NYT reported US intelligence believes a Megaspeed executive close to Jensen Huang was passing information to Beijing
• Nov 6: reports said her alleged goal was to push Huang to lobby for AI chip exports to China
• Nov 9: Nvidia opens an investigation, and the stock sinks
• Nov 12: Huang resigns as CEO, effective immediately. NVDA opens -13%.
Why it matters:
Nvidia is at the center of the US-China AI race. Its most advanced chips can’t be sold to China. When the face of the AI trade gets hit, tech risk appetite drops, and crypto trades as a risk asset.
In between, the market also took midterm volatility (-7%) and a hot CPI print (0.4% MoM vs 0.3% expected, -5%).
2 weeks. 4 headlines. 2 of them started on the same day.
Here’s what didn’t happen:
Spot buyers didn’t leave. Binance withdrawals resumed with only a 2.1% net outflow. Shorts are now the most crowded I’ve tracked.
None of these headlines were about Bitcoin.

$BTC
Upside liquidity: 15.73B
Downside liquidity: 2.96B
Ratio: 5.3x
Which way do you think price wants to go?

$BTC
Bullish: shorts overextended at -20B (was -12B).
Bearish: low-leverage longs from 85k have liquidations down to 64k.
Short-term relief makes sense.
But bigger picture, 64k is still on the map.

$BTC
Exchanges are buying every dip since the Binance Hack!
Four headlines in two weeks, and spot CVD is still +1.06B...
Price is falling. Spot demand isn’t.
Hidden signs of strength. 💪

$BTC
Here we go again.
2 weeks. 4 headlines.
Binance hack ➜ Midterms ➜ Hot CPI ➜ Nvidia CEO resigns
Every time the market resets, another headline hits.

$BTC
Pressure is building under the trendline.
Close above 74.5k (1hr) ➜ LTF break confirmed
Close above 75.5k (1d) ➜ first real sign of strength
Not chasing until it breaks.

$BTC
Open interest is climbing to extreme levels while price drops.
That means new money is opening shorts.
Last time OI was this high (August 17), BTC rallied 26% the following week.
Late shorts + extreme OI = squeeze fuel.
Not turning bearish here.

$BTC
The charts didn’t break Bitcoin. The headlines did.
Reported Binance hack ➜ -5%
Midterms / tech selloff ➜ -7%
Hot CPI ➜ -5% (so far)
At some point, bad news stops working.

$BTC
Bears: liquidations at 72.3–73.3k.
Bulls: shorts overextended at -12B.
Spot volume: still high.
Strength is building in this range.
When the crowd leans this hard one direction, the market usually goes the opposite.
I expect a push toward 80k soon.

$BTC
Binance spot buyers are stepping in HARD.
Last time we saw this flow, price bounced from 76k to 81k.
Spot leads. Price usually follows.

$BTC
“Let the price come to this level.”
It did. 73.3k, right in the pocket.
Bought spot at $74k.
Patience pays off.


$BTC
The liquidation pocket below has increased in the 73-76k range (left).
Levels like this often get front-run, with price turning before it fully taps the liquidity.
Liquidation Delta also overextended, suggesting too many shorts in the market (right).
Best practice: Either let the price come to this level, or break the trendline first.
Try not to force.

3
46
4,455

$BTC
Last time price came down here, this pocket got front-run.
It’s building again.
Patience got me in at 76k.
Adding at 73-75k if it comes.

$BTC
The liquidation pocket below has increased in the 73-76k range (left).
Levels like this often get front-run, with price turning before it fully taps the liquidity.
Liquidation Delta also overextended, suggesting too many shorts in the market (right).
Best practice: Either let the price come to this level, or break the trendline first.
Try not to force.
$BTC
Wild 48 hours.
76k ➜ 81k yesterday. Back to 76k today as tech stocks dumped at the open. Landed right back in the 73-76k pocket I flagged on Monday.
No new trades yet today. Let's see how BTC handles the 75-76k range first.
Patience is the position.

$BTC
I see two possible scenarios this week:
1. Sweep lower ➜ tag the liquidation cluster at 74-76k first, then bounce.
2. Front-run the delta ➜ push straight toward 80k with no dip filling the FVG.
Midterms are tomorrow (Nov 3), so expect volatility around the results... don’t overtrade it.
I’m not picking a side on BTC until it shows its hand. If BTC sweeps lower first, that’s where I’d look to reload.
Ultimately looking for a close above 78k for BTC today / tomorrow (for safer longs on ALTS).
Between now and then, don’t chase green candles.

$BTC
Spot volume fading as price drifts down.
Not bearish, just normal after a 76k ➜ 80k run.
Still in from $76k
Looking to add at 78-79k
Invalidation unchanged

$BTC
Waiting is the hardest part of trading.
It’s also the part that gets you the good entries.
Not exciting. Just effective.
Filled at $76k, right where I said I’d be looking.

9
43
3,891
$BTC
Exactly what I wanted to see!
76k held as support, and price is working back toward local range resistance near 81.3k.
Next step: hold 80k / trendline, then break 81.3k.
The recovery’s on track. Resistance just has to break.
Who else got in at 76k?

$BTC
Waiting is the hardest part of trading.
It’s also the part that gets you the good entries.
Not exciting. Just effective.
Filled at $76k, right where I said I’d be looking.