

How to make better investment decisions with CanadianInsider https://nitter.cf/t.co/lgXp3FboAN Read our website disclaimer
- Tweets10.3K
- Following417
- Followers2.4K
- Likes3.2K




ALT Canadian Insider by INK Research "Sharpen your investing with the INK Edge Our proprietary ranking of stocks on value, insider commitment and price momentum has beat both the S&P 500 and S&P/TSX Composite Index over the past decade, as measured by the INK Canadian Insider (CIN) Index." A bar chart of 10 year annualized returns shows the INK CIN Index at 16.7%, the S&P 500 at 15.2% and the S&P/TSX Composite at 12.8%. A second panel titled "INK Edge Morning INK Report Big Wins," with the line "Year-after-year across different sectors," lists Hammond Power Solutions up 1,629.7% from Sept. 7, 2022, Montage Gold up 3,065.0% from Oct. 20, 2023, and Tenaz Energy up 808.4% from July 24, 2024. Fine print says index returns are estimated local currency total returns as of June 30, 2026, stock returns run from the report date to September 30, 2026, and past performance does not guarantee future results. invites readers to join the Canadian Insider Ultra Club and save 50% with code 50OFF

ALT Mining insider sentiment jumps as stocks slump Market INK Live today at 1:00 PM ET/ 11:00 AM PT

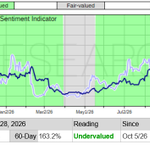
ALT One year chart of the INK Energy Sentiment Indicator, value of 163.2% as of Oct 28, 2026

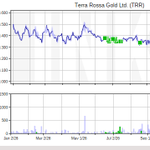
ALT Terra Rossa Gold year-to-date insider chart from INK Research


ALT One-year mystery chart
ALT One year chart of the INK Energy Sentiment Indicator, value of 163.2% as of Oct 28, 2026

ALT Newton's cradle with chrome spheres on a rustic wooden base image by Sunder Muthukumaran.

ALT Thumbnail of Market INK Live from Oct. 26, 1PM ET and 10AM PT


ALT Canadian Insider quote for Bitcoin to USD showing a last price of 79,506.75, down 1,631.12 or 2.01% on the day, from Binance data refreshed at 11:36 ET. The daily chart below runs from late November 2025 to late October 2026. Bitcoin peaked near 97,000 in mid January, then plunged to about 63,000 in early February. It recovered to roughly 82,000 by May before sliding to a low near 59,000 around the start of July. A sharp rally in August lifted it to about 87,000 in September, and it has since eased back to around 79,500.


ALT Chart of VersaBank (VBNK) share price and insider activity from late July to late October 2026. The stock drifted down from about $28 in late July, when an officer sold, to roughly $26.50 by late August. It then jumped to about $31 in early September on a spike in trading volume and climbed to around $33 by late September before settling near $32.50. Insiders bought steadily through the rise, with an officer purchase near $31 in early September, three director purchases between about $31 and $32 in September, and two more officer purchases near $32 in mid October. One officer sale occurred in early October at about $32.

ALT Line chart of Canfor Corporation (CFP) share price from late April to late October 2026, sourced from CanadianInsider.com. The stock started near 12.60, dipped to about 11.80 in early May, then climbed to roughly 14.00 by early June on a sharp volume spike. It traded between 13.20 and 14.50 through July before rallying to about 15.80 in early August. After pulling back to near 13.90 in early September, it peaked around 16.25 in mid-September, slid to about 14.10 in mid-October and rebounded to 15.23 at the latest close. Green up arrows marking insider buying appear in a cluster at the start of the period and again in late May, June, July, early August, mid-September and early October, while a single red down arrow marking insider selling appears near the early August high.


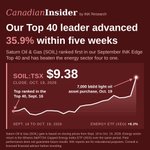
ALT Canadian Insider by INK Research chart card. Headline reads “Our Top 40 leader advanced 35.9% within five weeks.” Saturn Oil & Gas (SOIL:TSX) ranked first in the September INK Edge Top 40 and has beaten the energy sector four to one. A line chart shows the stock rising from its Sept. 16 ranking date to a $9.38 close on Oct. 19, 2026, with a sharp jump on Oct. 19 after a 7,000 bbl/d light oil asset purchase. Over the same period, the energy ETF (XEG) gained 8.3%. Past performance does not guarantee future results.


ALT Top 40 heavyweights Canadian Natural Resources and IAMGOLD have outpaced the S&P/TSX Composite Index since the start of the second half of the year.
ALT Top 40 heavyweights Canadian Natural Resources and IAMGOLD have outpaced the S&P/TSX Composite Index since the start of the second half of the year.


ALT Canadian Insider insider chart with the stock rising sharply on October 19th to close at $9.38


ALT INK Energy Indicator one-year chart with the 60-day above 100% and the 30-day above 350%.
ALT Canadian Insider by INK Research "Sharpen your investing with the INK Edge Our proprietary ranking of stocks on value, insider commitment and price momentum has beat both the S&P 500 and S&P/TSX Composite Index over the past decade, as measured by the INK Canadian Insider (CIN) Index." A bar chart of 10 year annualized returns shows the INK CIN Index at 16.7%, the S&P 500 at 15.2% and the S&P/TSX Composite at 12.8%. A second panel titled "INK Edge Morning INK Report Big Wins," with the line "Year-after-year across different sectors," lists Hammond Power Solutions up 1,629.7% from Sept. 7, 2022, Montage Gold up 3,065.0% from Oct. 20, 2023, and Tenaz Energy up 808.4% from July 24, 2024. Fine print says index returns are estimated local currency total returns as of June 30, 2026, stock returns run from the report date to September 30, 2026, and past performance does not guarantee future results. invites readers to join the Canadian Insider Ultra Club and save 50% with code 50OFF