

Unlocking Web3 Data Like an oil refinery for blockchain, we turn raw data into valuable, data-driven insights, helping users thrive in the Web3 economy
Joined August 2021
- Tweets2K
- Following168
- Followers5.3K
- Likes6K
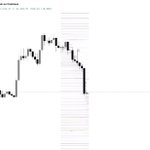




$BTC’s 3D doji hints the selloff may be losing steam.
Our heatmap puts $60K in focus as potential support, with liquidity stacked below price.
The edge is seeing where buyers are positioned before the next test.
Map the next move with ChainStats Pro.

4
285
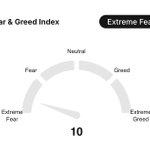
Fear & Greed: 10. Extreme Fear.
Conviction gets tested here. Opportunity can take shape before confidence returns.
Sentiment alone won’t confirm a bottom. We’re looking for buyers absorbing sell pressure while the crowd stays fearful.
Watch the liquidity. The mood follows.

1
337
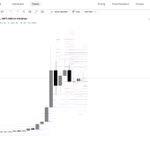
$QNT’s stalled rallies had a story beneath the candles.
Our orderbook heatmap revealed layered sell liquidity consistent with distribution, capping upside.
ChainStats makes that pressure visible. As supply gets absorbed, the path higher can open.

$XRP at $1.03 as holders clash with Ripple over price and promises.
Our heatmap shows liquidity near $1.00 and $0.95, with overhead orders around $1.10–$1.21.
Sentiment is bruised. A recovery still needs buyers to show up.
Follow the positioning with ChainStats Pro.

2
5
515
$QNT is testing $175–$180 again.
Our heatmap shows liquidity near $170 and $150–$160. Buyers need to absorb the selling. Reclaiming $190–$200 would be the first sign of strength.
Resting orders show intent. Fills tell the story.
Track liquidity with ChainStats Pro.

$BTC faces a confidence test after the Binance hack.
Our heatmap shows bids near $75K and $70K. Holding $75K and reclaiming $78K–$80K would strengthen the recovery case.
Buyers have a chance to build a base.
Track the liquidity with ChainStats.

1
3
380
$QNT is consolidating around $256 after an expansion move higher.
Buyers are supporting the mid $240s, while sell side liquidity sits around $280–$320. If buyers keep absorbing supply, that upper liquidity becomes the next area to watch.


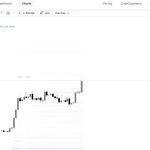
$BTC buyers keep chipping away at the sell wall. Seller confidence is starting to fade as distribution gets pulled.
Next significant liquidity sits around $85K and $90K.
Upgrade your strategy with ChainStats.

3
354
$BTC is on the move.
While some are buying, liquidity is telling a different story.
Don’t get caught guessing through the volatility. Use ChainStats Order Flow Liquidity Maps to see where liquidity is building, where it’s being pulled, and where the market may react next.

$QNT is trading near $60, with the strongest visible bid liquidity stacked below around $50–$56.
Orderflow reveals where buyers are positioned before price makes its next move.
Follow the liquidity. Track the orderbook live on ChainStats.

$QNT is pressing the lower end of its range while the orderbook shows liquidity building beneath price and thinner depth overhead.
That’s why orderflow matters: it shows where participants are positioned, not just where price has been.
Signal over noise.

Zoom out and follow the liquidity.
Our 3D $BTC order book heatmap shows where bids and asks are building around price, helping traders spot potential support, resistance, and liquidity zones before they become obvious.
See the market differently with ChainStats.

3
335

Orderflow reveals why price grinds higher, where resistance is building, and how market participants are positioning bids and asks. Explore ChainStats and unlock a deeper level of market analytics.

How to read this $QNT orderflow chart:
Candles show price. The orderbook shows where liquidity is stacked.
Darker bands = larger orders. Liquidity above can act as resistance while liquidity below can act as support or a price magnet.
Watch what stays, gets pulled or absorbed.

Want to know where the potential liquidity zones are for $QNT?
Our order book heatmaps turn complex order flow into a clear visual, making it easier to identify where liquidity may be building above and below price.

6
621

#ETH's current range is clearly defined and displayed with precision on our upgraded Order Flow Heatmap.

3
402