

Reaching financial freedom … one chart at a time 📈🌱 Join the TCC Discord for only $1/month. NFA.
USA
Joined July 2025
- Tweets4.9K
- Following463
- Followers6.8K
- Likes11K





Pinned Tweet
The Chartradamus Charts Server - NOW OPEN!
After sharing my analysis on this platform for over a year, I am excited to introduce a dedicated server where I will consolidate all of my work under one roof, expanding the depth and frequency of my coverage.
This will create a more accessible and interactive environment for analysis, education, collaboration, and chart requests, allowing me to engage more directly with all of you throughout the day.
The TCC Server, at this time, includes...
➯ General Chat w/ Chart Requests
➯ Technical Analysis (Individual Tickers + Indices)
➯ Fundamental Deep Dives
➯ Portfolio Breakdowns w/ Buys & Sells
➯ TCC Newsletter (Bi-Weekly OR Monthly TBD)
➯ Educational Resources (Video Lessons Eventually?)
➯ Chart Repository
➯ GEX/VEX Terrashade Heatmaps
➯ Unusual Whales Bot
It will take time to adjust. I will try my best to adapt to this new role over the next couple weeks, ironing out server-side kinks and my process. I feel taking on greater responsibility through this venture will motivate me to work harder and provide far greater content to you all, only improving as the server progresses.
Membership is $1/month. Access can be gained through Whop. The small fee is simply intended to keep bots and spam out while I build this community. If enough members join, I intend to put the funds towards investing in other tools (e.g. live options flows) to improve your experience.
The link for access can be found below. It is also linked in my X bio. If you have any questions, feel free to ask.
whop.com/the-chartradamus-ch…
Thank you to everyone who has supported my work all this time. This is only the beginning.
Disclaimer: All content shared by The Chartradamus Charts is intended for informational and educational purposes only and does not constitute personalized financial or investment advice. Any analysis, opinions, price targets, or trade ideas reflect independent research and are not recommendations to buy or sell securities. Investing involves risk, including the potential loss of capital. Always conduct your own due diligence and make financial decisions based on your individual circumstances and risk tolerance.


4
53
3,075
So far so good. Open to increasing exposure even further in the event the market flips and wants to trap late Bears in the next days.
Doubting that outcome for now. Data across the board now points towards a strong Local Low having extremely high odds after today. Now it's a matter of whether this relief can convert the LL to a Major Low with a recovery to ATHs.
My portfolio now consists of $CLS $COHR $CRDO $MRVL $MU $NVDA $NBIS $BE.
Important to have a place to put money where your mouth is. Prove that it's not all sunshine and rainbows. That your words carry weight.


1
24
1,133
Every person I personally know aged 60 or younger is involved in the AI/SI ecosystem to some degree. Whether that is through the content they consume, the poaching of their data, or using it as a tool to augment their own work/daily activities.
It’s important to recognize that we are in the midst of a paradigm shift in society, and we are only in its infancy. Billions more will be a part of this change in time. There will be no choice provided to us, as unfortunate as that is to say. These mega-corporations are essentially building the highway upon which the next evolution of the Internet will operate.
Demand appears insatiable. As AI becomes increasingly ingrained in everyday life and we transition toward an era of robotics and automation, that demand will only grow more pervasive.
I struggle to envision a world in which the broader AI revolution fails. Will there be spectacular failures along the way? Absolutely. Could we be ahead of ourselves in certain respects, reminiscent of 1999–2000? Certainly.
But there is a distinction between a speculative bubble bursting and the underlying technological revolution failing. The only event that could capsize this inflection point entirely would be an end to our civilization as we know it.
The Internet survived the Dot-Com Bubble. I expect AI/SI advancement to survive every speculative cycle it encounters too.
Is it time etch it into the history books?
Or will we have to call it the GTA VI Low instead? Tomorrow will let us know.
Today has been the most positive read I’ve had on the market since the June Major Top. If MMs want it, now is an appropriate time to “send it”.

16
1,174
Chartradamus retweeted
Stocks Watchlist & Key Levels ✍️
These are the prices + support ranges I am monitoring on the road lower should individual stocks and indices fail to establish higher lows off their respective November 5th bottom.
Read the important notes shared below this list...
$NVDA ➯ $149-$152 / $135 / $123
$MU ➯ $650 / $620 / $477-$513
$AVGO ➯ $290-$295 / $251 / $215-$221
$MRVL ➯ $125-$133 / $103-$108
$COHR ➯ $160 / $130-$143 / $110
$CRDO ➯ $107-$111 / $87 / $72-$79
$ALAB ➯ $162-$178 / $135
$GLW ➯ $102 / $87-$95
$CLS ➯ $198 / $185 / $130-$145
$VRT ➯ $171 / $148-$155 / $124 / $85-$95
$BE ➯ $169 / $147-$156 /
$GEV ➯ $640-690 / $610 / $570
$FIX ➯ $945-$980 / $850
$NBIS ➯ $98-$102 / $94 / $73-$86
$PENG ➯ $37 / $29-$31
$ASTS ➯ $26-$29 / $24 / $21 -> $16s
$OUST ➯ $24-$28
$MP ➯ $29-$34 / $25 / $20
The Bear Case price targets carry a considerably lower probability of being reached at this time. They represent more extreme downside scenarios, with multiple areas of confluent support worth identifying should broader market conditions deteriorate into Bear Market price action on larger timeframes.
Macro index data is beginning its descent toward cyclical lows, while several former market leaders are becoming increasingly stretched to the downside, reminiscent of March 2026. Should the attempted Higher Lows fail across the board, I anticipate many of these stocks could develop Daily RSI Bullish Divergence, potentially signaling a Local Low. Whether that evolves into a sustained recovery will depend heavily on its alignment with an index-side Major Low.
Note: Landing on a support level/range is not a signal to take an entry or add to your position. It must first be reviewed to see if there are signs of impending reversal on the individual ticker OR indices relevant to it simultaneously. Pay close attention to how price interacts with support. A weak reaction, repeated tests, or failure to reclaim a broken level may signal that price favors continuation toward lower support zones rather than a durable reversal. Even if relief develops off support, the stock is not out of the woods until it begins reclaiming overhead levels. Former support converting into resistance is a significant red flag, particularly when accompanied by RSI Bearish Divergence. Following any rejection, the next priority is determining whether price can establish and defend a Higher Low. Failure to do so increases the probability that the bounce was merely countertrend relief rather than the beginning of a sustained recovery.
Chartradamus retweeted

$QQQ hit its 350 DMA which means that the 80 trading day low may be in. In an expanded flat correction wave C contains 5 waves. So far wave 5 has been the shortest wave. If wave 5 = wave 1 QQQ might fall to 634, so we have to wait for NVDA earnings before we can say the low is in

Chartradamus retweeted

Is that the low?
SPX Nov 7500 Puts unwound
Be careful - here’s my quick unedited take
$NBIS
There we go. Finally reached the initial level for accumulation of $102.
Downside risk of retracing towards $73-$86 remains, but the confluence of its Volume Shelf and .5 Log Fib ($102) co-existing here with RSI Bullish Divergence built on the Daily is very promising.
I took a starter that I am willing to DCA.
$NBIS 🟡 LT Wave 2 Confirmation
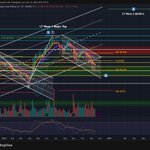
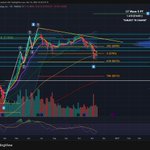
"Nebius is hanging on by a thread, retesting the previous week's lows overnight. This coincides with the Weekly 100MA ($110), a particularly important level given its confluence with the .618 Log Fib ($110). Whether buyers can defend this area will be instrumental in determining the next leg of the correction. Should this support fail, I see a couple particularly significant areas of technical confluence that could attract substantial buying interest.
The 1st is the $100–$102 Region. This holds the Volume Point of Control (POC) near $100, established during the prolonged Primary Wave 4 consolidation from late 2025 into early 2026 that occurred within LT Wave 1. This region shares confluence with the .5 Log Fib ($102), creating what I consider the first compelling area for initiating confident entries and beginning a disciplined DCA strategy.
The 2nd is the $73–$86 Region, acting as the High-Value Accumulation Zone. This is headed by the Weekly 200MA ($86). An inflection point for deep corrective moves, especially in LTW2. Again, this shares confluence with yet another Log Fib ... the .236 Log Fib ($86). If this fails, it would simply mean the Falling Knife continues until the .786 Fib ($75) retracement of LTW2 is reached, which has its own confluence with February 2026 lows and a swath of Buy Order Blocks on higher timeframes. Genuinely hard to fathom it not holding this if it came. My Bear Case is this region mentioned here ... let's see how the initial tests above of $100-$110 acts though."


1
29
3,716
*Excerpt from TCC Discord*
"Okay here we go. We just swept November 5th lows on $SPY $QQQ.
Each could not hold the higher low. This is the chance for $ES_F $QQQ to put in a Double Bottom off RSI Bullish Divergence on the Daily. It needs to hold around these levels and enforce a $VIX crush. It is a big ask."
Intraday Stocks-Above Data, 1H and potentially Daily RSI Bullish Divergences, and the GEX/VEX King Nodes for $SPX being at $7300 are the reasons to justify a bounce attempt here. However, due to elevated volatility, these calls are difficult intraday. There is still strong odds of forming Lower Lows on indices in the event that $NVDA earnings see a poor reaction.
However, technically, $NVDA as a stock seems extremely stretched here and landed on support of $149-$152 today ahead of the ER. A positive reaction will lead to a rubberband countertrend rally. If that fails, it will drop towards $123-$135 at worst. The fact that $NVDA is so near a bounce point, gives comfort in $SPY $QQQ potentiating a Local Low soon.


1
16
1,455
Stocks Watchlist & Key Levels ✍️
These are the prices + support ranges I am monitoring on the road lower should individual stocks and indices fail to establish higher lows off their respective November 5th bottom.
Read the important notes shared below this list...
$NVDA ➯ $149-$152 / $135 / $123
$MU ➯ $650 / $620 / $477-$513
$AVGO ➯ $290-$295 / $251 / $215-$221
$MRVL ➯ $125-$133 / $103-$108
$COHR ➯ $160 / $130-$143 / $110
$CRDO ➯ $107-$111 / $87 / $72-$79
$ALAB ➯ $162-$178 / $135
$GLW ➯ $102 / $87-$95
$CLS ➯ $198 / $185 / $130-$145
$VRT ➯ $171 / $148-$155 / $124 / $85-$95
$BE ➯ $169 / $147-$156 /
$GEV ➯ $640-690 / $610 / $570
$FIX ➯ $945-$980 / $850
$NBIS ➯ $98-$102 / $94 / $73-$86
$PENG ➯ $37 / $29-$31
$ASTS ➯ $26-$29 / $24 / $21 -> $16s
$OUST ➯ $24-$28
$MP ➯ $29-$34 / $25 / $20
The Bear Case price targets carry a considerably lower probability of being reached at this time. They represent more extreme downside scenarios, with multiple areas of confluent support worth identifying should broader market conditions deteriorate into Bear Market price action on larger timeframes.
Macro index data is beginning its descent toward cyclical lows, while several former market leaders are becoming increasingly stretched to the downside, reminiscent of March 2026. Should the attempted Higher Lows fail across the board, I anticipate many of these stocks could develop Daily RSI Bullish Divergence, potentially signaling a Local Low. Whether that evolves into a sustained recovery will depend heavily on its alignment with an index-side Major Low.
Note: Landing on a support level/range is not a signal to take an entry or add to your position. It must first be reviewed to see if there are signs of impending reversal on the individual ticker OR indices relevant to it simultaneously. Pay close attention to how price interacts with support. A weak reaction, repeated tests, or failure to reclaim a broken level may signal that price favors continuation toward lower support zones rather than a durable reversal. Even if relief develops off support, the stock is not out of the woods until it begins reclaiming overhead levels. Former support converting into resistance is a significant red flag, particularly when accompanied by RSI Bearish Divergence. Following any rejection, the next priority is determining whether price can establish and defend a Higher Low. Failure to do so increases the probability that the bounce was merely countertrend relief rather than the beginning of a sustained recovery.
Pondering the striking similarities between $NVDA’s Monthly chart from 2018–2022 and the developing structures of $FIX and $CLS from 2024–2026.
As of now, I do not anticipate a Bear Market occurring in 2027 comparable to that of 2022. The macroeconomic backdrop was considerably more hostile then, with far more aggressive monetary tightening, parabolically surging inflation, and the economic distortions that followed the pandemic.
The technical parallels between these tickers are worth studying, particularly how powerful fundamental inflections can be interrupted by substantial corrections without necessarily derailing the longer-term secular growth story. However, that long-term story can always be put in jeopardy near-term. As we are seeing now for $CLS $FIX. The degree to which it is put into jeopardy matters though. It can always simply amount to noise.
$NVDA was able to find support off its Monthly 50MA while suffering a deterioration in its fundamentals due to an economic slowdown in 2022, putting a pause on its inflection for an extended period of time. As of now, there is no sign of this occurring for $CLS $FIX to enforce a drawdown as deep as the Monthly 50MA, but it is always possible in the event the new regime of $NVDA decides to put a damper on its circular financing model and liquidity tightens up significantly moving forward. Until these hypotheticals become fact, there is no point in worrying about them.
I see the ongoing correction in the market de-risking ahead of this possibility. That is all it is right now. A possibility. Rate hikes are coming - that is undeniable. But if, in the face of that, these companies are successful in the years ahead, I look forward to whether their charts will also look similar to $NVDA coming out of its unwind.


1
16
1,858
If you're unwilling to digest and learn from in-depth analysis ... you do not want it enough.
Success demands dedication and time in this specialty. Only 1-in-10 retail investors outpace the S&P 500 in ROI over the course of a decade. It is up to you if you want to be that 1.
2
35
1,876
Broader Market Data 🚨 IMPORTANT
The tide is finally starting to turn for those who have remained patient.
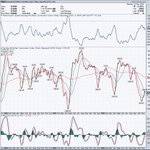
The McClellan Oscillators for $SPX + $IXIC are finally rolling over, breaking away from the stubbornly resilient positive readings maintained throughout much of the past month. However, I desire considerably deeper negative readings on those and the $NYMO before we can confidently identify a durable low. Preferably around -40 to -60 or lower.
Ideally, the additional downside on indices required for cyclical lows on the oscillators will coincide with the Stocks Above Data deteriorating towards readings of 20 or lower. This will force the kind of breadth extremes historically associated with Major Lows and subsequent recovery attempts.
It is worth remembering, however, that the Stocks Above data bottomed prematurely in March, establishing Bullish Divergence well before the broader market recovery began. On occasion, it can serve as a delayed indicator rather than a coincident one.
One particularly interesting development I am monitoring involves the $NASI (NASDAQ McClellan Summation Index). Should the McClellan Oscillators deteriorate further to readings discussed above, an opportunity may emerge for $NASI to establish Bullish Divergence against the indices. Specifically, if $SPX and $IXIC continue searching for Lower Lows while $NASI establishes a Higher Low. This would be a clear signal to begin evaluating longs if coupled with other pieces of data firing buy signals.
Keep your eyes peeled. This could be the start of the final leg lower if the Higher Low fails on $SPX $SPY $IXIC $QQQ in the coming days. About time. The market has been testing my patience. Although I captured profits trading the bounce off the November 5 lows, I refrained from calling a Major Low then because the underlying data had yet to confirm one. That narrative is beginning to shift.


Still easing into managing the server, having spent much of today onboarding members and handling support requests behind the scenes.
Moving forward, I intend to prioritize intraday analysis, real-time updates, and discussion within the Discord. I will share the most pertinent work from the day on X AFTER market closes every day.
Of course, any time-sensitive developments or analysis requiring immediate attention will be shared across all platforms ASAP.
This regimen will allow me to not spread myself too thin intraday and keep posts/expectations on X routine.
3
17
1,126