

Assistant Professor @PSUStatistics. I study stats methods, gerrymandering, & elections. Bayesian. Founder @UGSDW; proud @hgsuuaw alum.
State College, PA
Joined October 2020
- Tweets727
- Following325
- Followers856
- Likes1K



Who knows what the future holds, but for now I think I'm calling it a day on Twitter. Find me talking about stats, elections, labor, etc @corymccartan.com on the other site!
Cory McCartan retweeted

“The issue is not that deliverism failed. It is that Democrats convinced themselves that they had delivered, without listening to the voters telling them they had not.”
This quoted post is unavailable.
Cory McCartan retweeted

Promise I'll stop posting about this soon. But two things true
1) attitudes about race and immigration best separate Trump vs HRC, Biden, & Harris voters, including voters of color. Economic attitudes & real wage changes don't
2) calling people racist/sexist etc is bad politics

Yeah people are too quick to forget the absolute mess that was the Dem position in state houses ca. 2014. Incredible rebuilding and gains since then.

Cory McCartan retweeted

I cannot say this enough:
- Early exits are not suitable for demographic analysis or comparisons.
- AP/Votecast is still preliminary -- should be adjusted for final vote counts.
- We don't have Catalist. Or Pew validated voters.
It's just too early to have confident takes!
Cory McCartan retweeted

I think we - including me - are going to be tearing down Democratic policy, trends, comms, etc. for months to figure out what happened but after sleeping on it here are ten thoughts (that might not be true):
1) Democratic failures in urban governance coming to roost
100% to everything here. The micro story as to the shift from 2020 may be economy+ approval, etc. but the reason Trump exists is much deeper, obviously.

We must not delude ourselves in this moment. Multiracial democracy in the United States is less than 60 years old. It has always been contested, often violently so. It has always been fragile. Since this nation's inception large swaths of white Americans -- including white women -- have claimed a belief in democracy while actually enforcing a white ethnocracy. In the face of shifting demographics where white Americans will lose their numeric majority, we see a growing embrace of autocracy to keep the "legitimate" rulers of this country in power. History teaches us that we are in a perilous moment.
We need to contest this narrative very strongly. Dems didn't lose because of stimulus or industrial policy, they lost despite those things. The economy didn't improve in time and Harris didn't make a clean break with an unpopular incumbent.

End of night update: county-demographic models showing big uphill battle for Harris in PA, MI, WI.
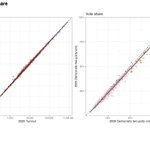
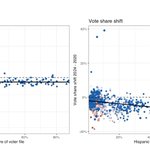
Patterns consistent w/~ 5pp underperformance with Hispanic voters and 2-3pp shift nationwide. First GOP popular vote win since '04 looking quite likely.


Should have mentioned this is Philadelphia county only! Moving too quickly here. But the consistency of the uniform shift across the nation is really striking.
Maybe a bit less shift in NC (reverse coattails from Robinson?)

Very lucky to be joining the @CBSNews data desk this evening, looking at precinct data from key battlegrounds. Currently forecasting 630K 2-party turnout with healthy uncertainty. Seeing a consistent 2-3pp deterioration in Dem margins across precincts

At the county level we're seeing a consistent 1.3pp shift against Dems; larger in more Democratic counties. Currently forecasting R+2-4pp shift in the popular vote versus 2020

Very lucky to be joining the @CBSNews data desk this evening, looking at precinct data from key battlegrounds. Currently forecasting 630K 2-party turnout with healthy uncertainty. Seeing a consistent 2-3pp deterioration in Dem margins across precincts

This is the crucial point that took me a while to realize. As a Bayesian I was resistant to "regularization is bad for casual inference" until it clicked that some innocent-looking priors may be quite informative about casual effects.

Cory McCartan retweeted

If done over RVs and turnout is adjusted by voting history on a voter file matching, it shouldn't make anyone nervous.
It's the most correlated variable you could have to current vote choice and evidence is that, once adjusted for turnout, there is minimal misreporting.

First, a comment: the roadway shares by race come from a private company, and we have no idea the quality of that data. Unfortunately the authors didn't share any raw data. To my mind, this isn't in the spirit of PNAS policies, but that's a separate question.

That said, the unfortunately high amount of residential segregation in Chicago may help out. Over half of Chicago tracts have a Black % that is <5% or >95%! So everyone from those tracts is well-identified, regardless of other assumptions. I.e., less sensitivity to imputation.
Saw this figure going around from the linked study. Methodologically interesting because they observe individual-level race for police stops but not camera tickets. Race for camera tickets is imputed from the census tract the ticket was mailed to.
Is this OK? Some thoughts.

Maybe the most powerful figure I’ve seen this year: the racial gap in tickets from speed cameras vs. officer stops.
pnas.org/doi/10.1073/pnas.24…
