Data Orbital (@Data_Orbital) header
Data Orbital (@Data_Orbital) profile picture

Led by @George_Khalaf, we're an analytics & survey firm crafting data-driven solutions for our clients. Top 10 pollster in America by @FiveThirtyEight.

Phoenix, AZ
Joined August 2016
Photo by Data Orbital (@Data_Orbital)Photo by Data Orbital (@Data_Orbital)Photo by Data Orbital (@Data_Orbital)Photo by Data Orbital (@Data_Orbital)Photo by Data Orbital (@Data_Orbital)Photo by Data Orbital (@Data_Orbital)Photo by Data Orbital (@Data_Orbital)Photo by Data Orbital (@Data_Orbital)Photo by Data Orbital (@Data_Orbital)Photo by Data Orbital (@Data_Orbital)
MARICOPA COUNTY | October 30 update PND/Other voters now account for more than one-quarter of Maricopa's early returns: 234,873 ballots, or 25.2%. Total returns stand at 930,881. Republicans lead Democrats by 5,316 ballots. A closer look. 🧵
2
1
11
1,068
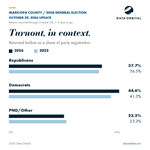
Maricopa's turnout is 36.0%, compared with 34.7% at the same point in 2022. 110,809 returns come from voters who participated in zero or one of the last four general elections. The 4/4 group accounts for 590,421. Two charts on participation and voting history.
2
244
ARIZONA BY COUNTY and LD| October 30 update PND/Other turnout varies across the larger counties: 29.6% in Yavapai, 26.7% in Pima, 24.0% in Maricopa, and 17.6% in Pinal. Each rate measures returns as a share of that group's registration. All 15 counties, in two tables. 🧵
1
5
1
16
3,681
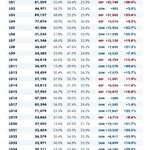
The largest raw Republican ballot advantages are in LD1 (+22,748) and LD30 (+22,419). The largest Democratic advantages are in LD20 (+19,155) and LD18 (+17,867). The full ballot-advantage and party-turnout tables cover all 30 legislative districts:
1
1
363
ARIZONA EARLY VOTING | October 30 update Arizona has passed 1.5 million early returns: 1,540,520 ballots are back. The Republican ballot advantage narrowed to 9,569, or 0.6% of returns, from 12,837 in yesterday's update. The statewide breakdown. 🧵
2
5
14
1,310
Nearly one in eight early returns comes from voters who participated in zero or one of the last four general elections: 192,363 ballots. Among 4/4 voters, 68.4% of issued ballots are back; among 0/4 voters, 19.0% are back. Turnout and voting history:
2
2
1,793
TODAY’S SPOTLIGHT: LD4 | October 29 73,811 early ballots returned. Overall turnout is 43.2%, ahead of 42.0% at the same point in 2022. Republicans hold a 3,105-ballot advantage—4.2% of returns, compared with 2.8% in 2022. A closer look at LD4. 🧵
1
1
9
1,174
More than half of LD4’s registered Democrats have returned a ballot: 57.4%, compared with 43.5% of Republicans and 32.1% of PND/Other voters. Voters who participated in all four prior general elections account for 52,349 returns. Turnout and voting history:
3
312
MARICOPA COUNTY | October 29 update More than one-third of registered voters have returned a ballot: 875,320 returns, or 33.8% turnout. At the same point in 2022, turnout was 33.3%. Republicans currently lead returned ballots by 7,784. A closer look. 🧵
1
2
1
14
1,646
Maricopa's latest update added 43,034 Democratic returns and 41,641 Republican returns, narrowing the Republican ballot advantage. Among 4/4 voters, 70.2% of Democratic issued ballots are back, versus 63.1% for Republicans. Turnout and voting history, side by side.
3
3
23
9,938
ARIZONA BY COUNTY and LD| October 29 update Pima's Democratic ballot advantage is 46,942. Yavapai and Mohave have Republican advantages of 21,526 and 19,910, respectively. The county totals show how those margins add up statewide. Ballot advantage and turnout in all 15 counties. 🧵
2
9
1
23
6,424
The LD picture is close in several districts: Democrats lead returned ballots by 661 in LD16 and 831 in LD2. Republicans lead by 1,219 in LD13. Compare the raw margins, share of returns, and turnout by party across all 30 legislative districts:
6
634
ARIZONA EARLY VOTING | October 29 update 1,439,257 ballots returned. Republicans hold a 12,837-ballot advantage; Democrats led by 24,415 at the comparable point in 2022. Overall turnout is close to 2022: 31.7% versus 31.6%. The statewide breakdown. 🧵
2
14
2
33
5,262
Voting history adds another view of Arizona's electorate. 913,378 returns come from voters who participated in all four prior general elections. Another 173,925 come from voters with zero or one. The turnout comparison and voting-history breakdown:
5
2
11
7,673
TODAY’S SPOTLIGHT: LD13 | October 28 46,816 early ballots returned. Republicans lead by 1,097 ballots—a 2.3% advantage, versus 2.4% at the same point in 2022. Overall turnout is nearly unchanged: 31.9%, compared with 32.0% in 2022. 🧵
1
1
3
1,078
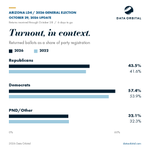
Similar overall turnout, different party trends in LD13. Democratic turnout is 42.6%, versus 40.0% in 2022. Republican turnout is 35.1%, versus 34.4%. PND/Other trails its 2022 rate: 21.5% versus 23.1%. Voters with a 4/4 general-election history account for 31,780 returns.
1
1
343
MARICOPA COUNTY | October 28 update Maricopa added 96,759 returned ballots since our previous update. The Republican ballot advantage widened from 7,660 to 9,177. The county now accounts for 755,873 of Arizona’s 1,260,057 returns. A closer look. 🧵
1
8
33
1,654
More ballots, nearly the same turnout: Maricopa has 9,231 more returns than at this point in 2022, but turnout is 29.2% versus 29.3%. Among voters who participated in all four prior general elections, 57.4% of issued ballots are back, compared with 13.9% for the 0/4 group. County and LD tables
350
ARIZONA BY COUNTY | October 28 update Gila shows why turnout and ballot advantage differ. Republican turnout is 37.7%, versus 36.8% for Democrats, yet Republicans lead returned ballots by 4,029—a 32.1% advantage. Both measures for all 15 counties. 🧵
2
9
24
1,684
In LD4, Democratic turnout has crossed 50%—now 51.1% of registration, versus 38.5% for Republicans. Republicans still lead returned ballots by 2,635, reflecting their larger registration. The ballot-advantage and turnout tables for all 30 LDs:
2
338