



$TSLA Continues to be my favorite stock to trade
374 target hit within 2 pennies!
just lucky


Expecting the "C" leg to get tagged soon near the 745 level if this harmonic pattern plays out in the S&P 500

A Harmonic Structure Unfolds in the S&P 500 and the case for 745 stockoptionalerts.com/chart-… $SPY $QQQ $META


S&P 500 DOUBLE TOP: THE BREAKDOWN IS UNDERWAY
Posted this chart a few days ago


S&P 500 Technical Outlook: Distribution Risk & Double Top stockoptionalerts.com/day-tr…

14
513

🇺🇸 𝕏 Day Traders Group 𝕏 🇺🇸 retweeted
S&P 500 Technical Outlook: Distribution Risk & Double Top stockoptionalerts.com/day-tr…
S&P 500 Technical Outlook: Distribution Risk & Double Top stockoptionalerts.com/day-tr…

🇺🇸 𝕏 Day Traders Group 𝕏 🇺🇸 retweeted
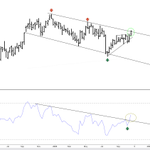
$TSLA Breaking out of this descending parallel on weekly, closing back below 400 negates the breakout
Target: 500 if this breakout holds

$TSLA Breaking out of this descending parallel on weekly, closing back below 400 negates the breakout
Target: 500 if this breakout holds
Primary aggregate flip gamma exposure level for Monday is clustering in the 775.1-775.7 range for The S&P 500 right now
Now trading below the gamma flip, with substantial negative gamma exposure concentrated around 750 - 755 #spy #StockMarket
The put wall has dropped to 750

🇺🇸 𝕏 Day Traders Group 𝕏 🇺🇸 retweeted
$SPY RSI trendline break accompanying the price trendline break suggests sellers not finished... stockoptionalerts.com/day-tr…

$SPY RSI trendline break accompanying the price trendline break suggests sellers not finished... stockoptionalerts.com/day-tr…
Primary aggregate gamma exposure level for Monday is clustering in the 767.7-769.7 range for $SPY
Put wall: 750
Call wall: 770 making these the key downside and upside gamma reference levels
Updating you guys on the net GEX daily, so if your following you'll get notified

2
15
527
