Deepali Kank (@DeepaliKank) header
Deepali Kank (@DeepaliKank) profile picture

✨Data Visualization Specialist and Data Analyst. 📊 Book nerd📚. Always seeking new insights and knowledge💡

India
Joined November 2019
Photo by Deepali Kank (@DeepaliKank)Photo by Deepali Kank (@DeepaliKank)Photo by Deepali Kank (@DeepaliKank)Photo by Deepali Kank (@DeepaliKank)Photo by Deepali Kank (@DeepaliKank)Photo by Deepali Kank (@DeepaliKank)Photo by Deepali Kank (@DeepaliKank)Photo by Deepali Kank (@DeepaliKank)Photo by Deepali Kank (@DeepaliKank)Photo by Deepali Kank (@DeepaliKank)
Deepali Kank retweeted
My iPhone Duo video went viral, so I'm giving away 100 iPhones on X 😛
93,129
94,805
6,624
142,175
5,791,348
#TidyTuesday week 36 - Henley Passport Index Data. This one created in #Tableau each column is a visa-free count; height = how many countries sit there. Tableau Public: public.tableau.com/app/profi… #DataViz
17
788
#TidyTuesday week 27 - The xkcd Color Survey Results. I used the data to create an artistic explosion of colors using #p5js. This dataset was the perfect playground for a little creative exploration. #dataviz
1
18
603
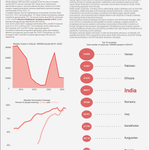
For this week's #TidyTuesday dataset, I explored India's journey toward measles elimination. The visual layout draws inspiration from newspaper format. Charts were created in R using #ggplot2 Layout designed in Figma. #DataVisualization #RStats
2
1
18
1,015
✨ Connect with fellow #dataviz humans—four minutes at a time! Join us for Data Viz Speed Chatting, a fast-paced, friendly event where you’ll rotate through small-group conversations guided by creative prompts. Each round is just 4 minutes—enough to spark ideas, swap stories, and leave inspired. 📅 May 31 at 3pm UTC 📍 Sign up here: buff.ly/1SBPNlP
1
2
1,108
Deepali Kank retweeted
For #VizChitra2025, meet speaker @Da_Pacific, Dataviz Developer, @reutersgraphics 🎙️Talk: “The Eyes Have It: Understanding Perception-Driven Data Visualisation” Learn how simple design choices make charts Catch this session and more: hasgeek.com/VizChitra/2025/#…
4
6
399
Deepali Kank retweeted
I am part of a community of Indian data communicators, developers, designers, researchers and others organising India's first data visualisation conference in June this year. We have 25 fully-funded places for people who would like to attend but face barriers. Deadline: tomorrow.
We’re offering full fee waivers on 25 tickets for diverse voices to attend #VizChitra2025 Apply now: tinyurl.com/VizChitrascholar Fill out the form by May 15 to claim your spot We want to see and hear you at India's first dataviz conference! Only 4 days left, apply today.
1
42
56
13,918
New Shiny app for this week's #TidyTuesday dataset featuring the upcoming useR! 2025 conference sessions! 🛠️ I built this using {shiny} and some custom styling , with help from AI along the way for troubleshooting and design nudges. deepalikank.shinyapps.io/use… #Rstats #DataViz
1
2
13
656
#30DayChartChallenge Day 4 - Big or Small and #TidyTuesday week 12 - Pokemon Data. #DataViz #Pokemon
3
31
1,446
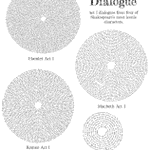
📊 Day 3 – Circular | #30DayChartChallengeA bit more on the art side today, visualizing Act I dialogues of Hamlet, Macbeth, Romeo, and Juliet as spirals. I’ve never created text spirals before, so this was a fun little challenge and a great learning opportunity. #Rstats #D3js
4
26
978
#30DayChartChallenge Day 1 - Fractions, I decided to take that quite literally. What better way to show fractions of time than by visualizing Dhoni’s lightning-fast stumpings. I created a set of stopwatch-style dials to show the dismissals. #DataViz #Rtsats #MSDhoni
1
22
803
#TidyTuesday week 12 - Text data from Amazon's annual reports. Created this proportional streamgraph of the positive and negative words with {ggstream} and also added the word cloud. #rstats #DataViz #Figma
21
715
#TidyTuesday week 11 - Palm trees. Visualized the max no of leaves per tribe using #rstats and edited in #figma #DataViz
1
27
962
Happy to share that both of my submissions for the 2024 Information is Beautiful Awards made it to the longlist! 📊✨ 🟣 Fragrance of data 🟣 Data Art #Dataviz #Rstats #DataArt
3
40
1,652
#TidyTuesday week 9 - Long Beach Animal Shelter. I took a creative approach to data visualization by analyzing the primary colors of animals at the Long Beach Animal Shelter (2017–2024) using #Rstats #RawGraphs and #Figma #dataviz
2
1
23
1,230
#TidyTuesday week 8 - Academic Literature on Racial and Ethnic Disparities in Reproductive Medicine in the US. Created this chart using {ggbrick}and edited in Figma. #Rstats #dataviz
3
8
52
2,824
#TidyTuesday week 7 - Agencies from the FBI Crime Data API. Code: github.com/deepdk/TidyTuesda… #Rstats #dataviz
4
34
1,954
Deepali Kank retweeted
🎉VizChitra Launch Party!🚀 Are you a data storyteller or aspiring to be one? Join our first virtual hangout with @chartwaali & @rasagy to connect, create & chat about data, design & innovation! Register here: hasgeek.com/VizChitra/launch… We can't wait to see you there!✨📊🎨
5
6
806