

Postdoc @UGA | Bayesian stats, NIMBLE, JAGS, LaTeX, and recently AI | but also cat photos. All views my own. She/her pronouns https://nitter.cf/t.co/oeWsSCkudA
Athens, GA
Joined October 2018
- Tweets2.8K
- Following313
- Followers723
- Likes2.9K




Heather Gaya, PhD retweeted

In 2023, GA GOP rolled out their failed pathway for access to health insurance program, promising it would cover 345,000 people. But two years later, just 6,503 Georgians are enrolled. The numbers don’t lie. #GeorgiaDems #workingfamilies #GeorgiaHouseDemocrats #GADems


Heather Gaya, PhD retweeted

Slavery was legal.
Segregation was legal.
Never use legality as a guide to morality.
Heather Gaya, PhD retweeted

Lauren Boebert calling for the abolishment of the Department of Education is like chlamydia speaking out about the dangers of antibiotics




Heather Gaya, PhD retweeted

i need non-americans to understand that 75 million of us did not vote for trump. i know it’s easy to hate america but please don’t forget many of us are terrified of what is to come and we did not vote for this. and do not laugh at our fear.
publish.csiro.au/WR/WR24175
Full paper link!

A good end to 2024! Let's see what 2025 has in store!
publish.csiro.au/WR/justacce…
1
168
I absolutely love my tax accountant but she talks very rapidly and loudly and every interaction with her is very jarring. I feel like I'm having another PhD oral exam and I have distinctly *not* prepared ahead of time.
129
A good end to 2024! Let's see what 2025 has in store!
publish.csiro.au/WR/justacce…
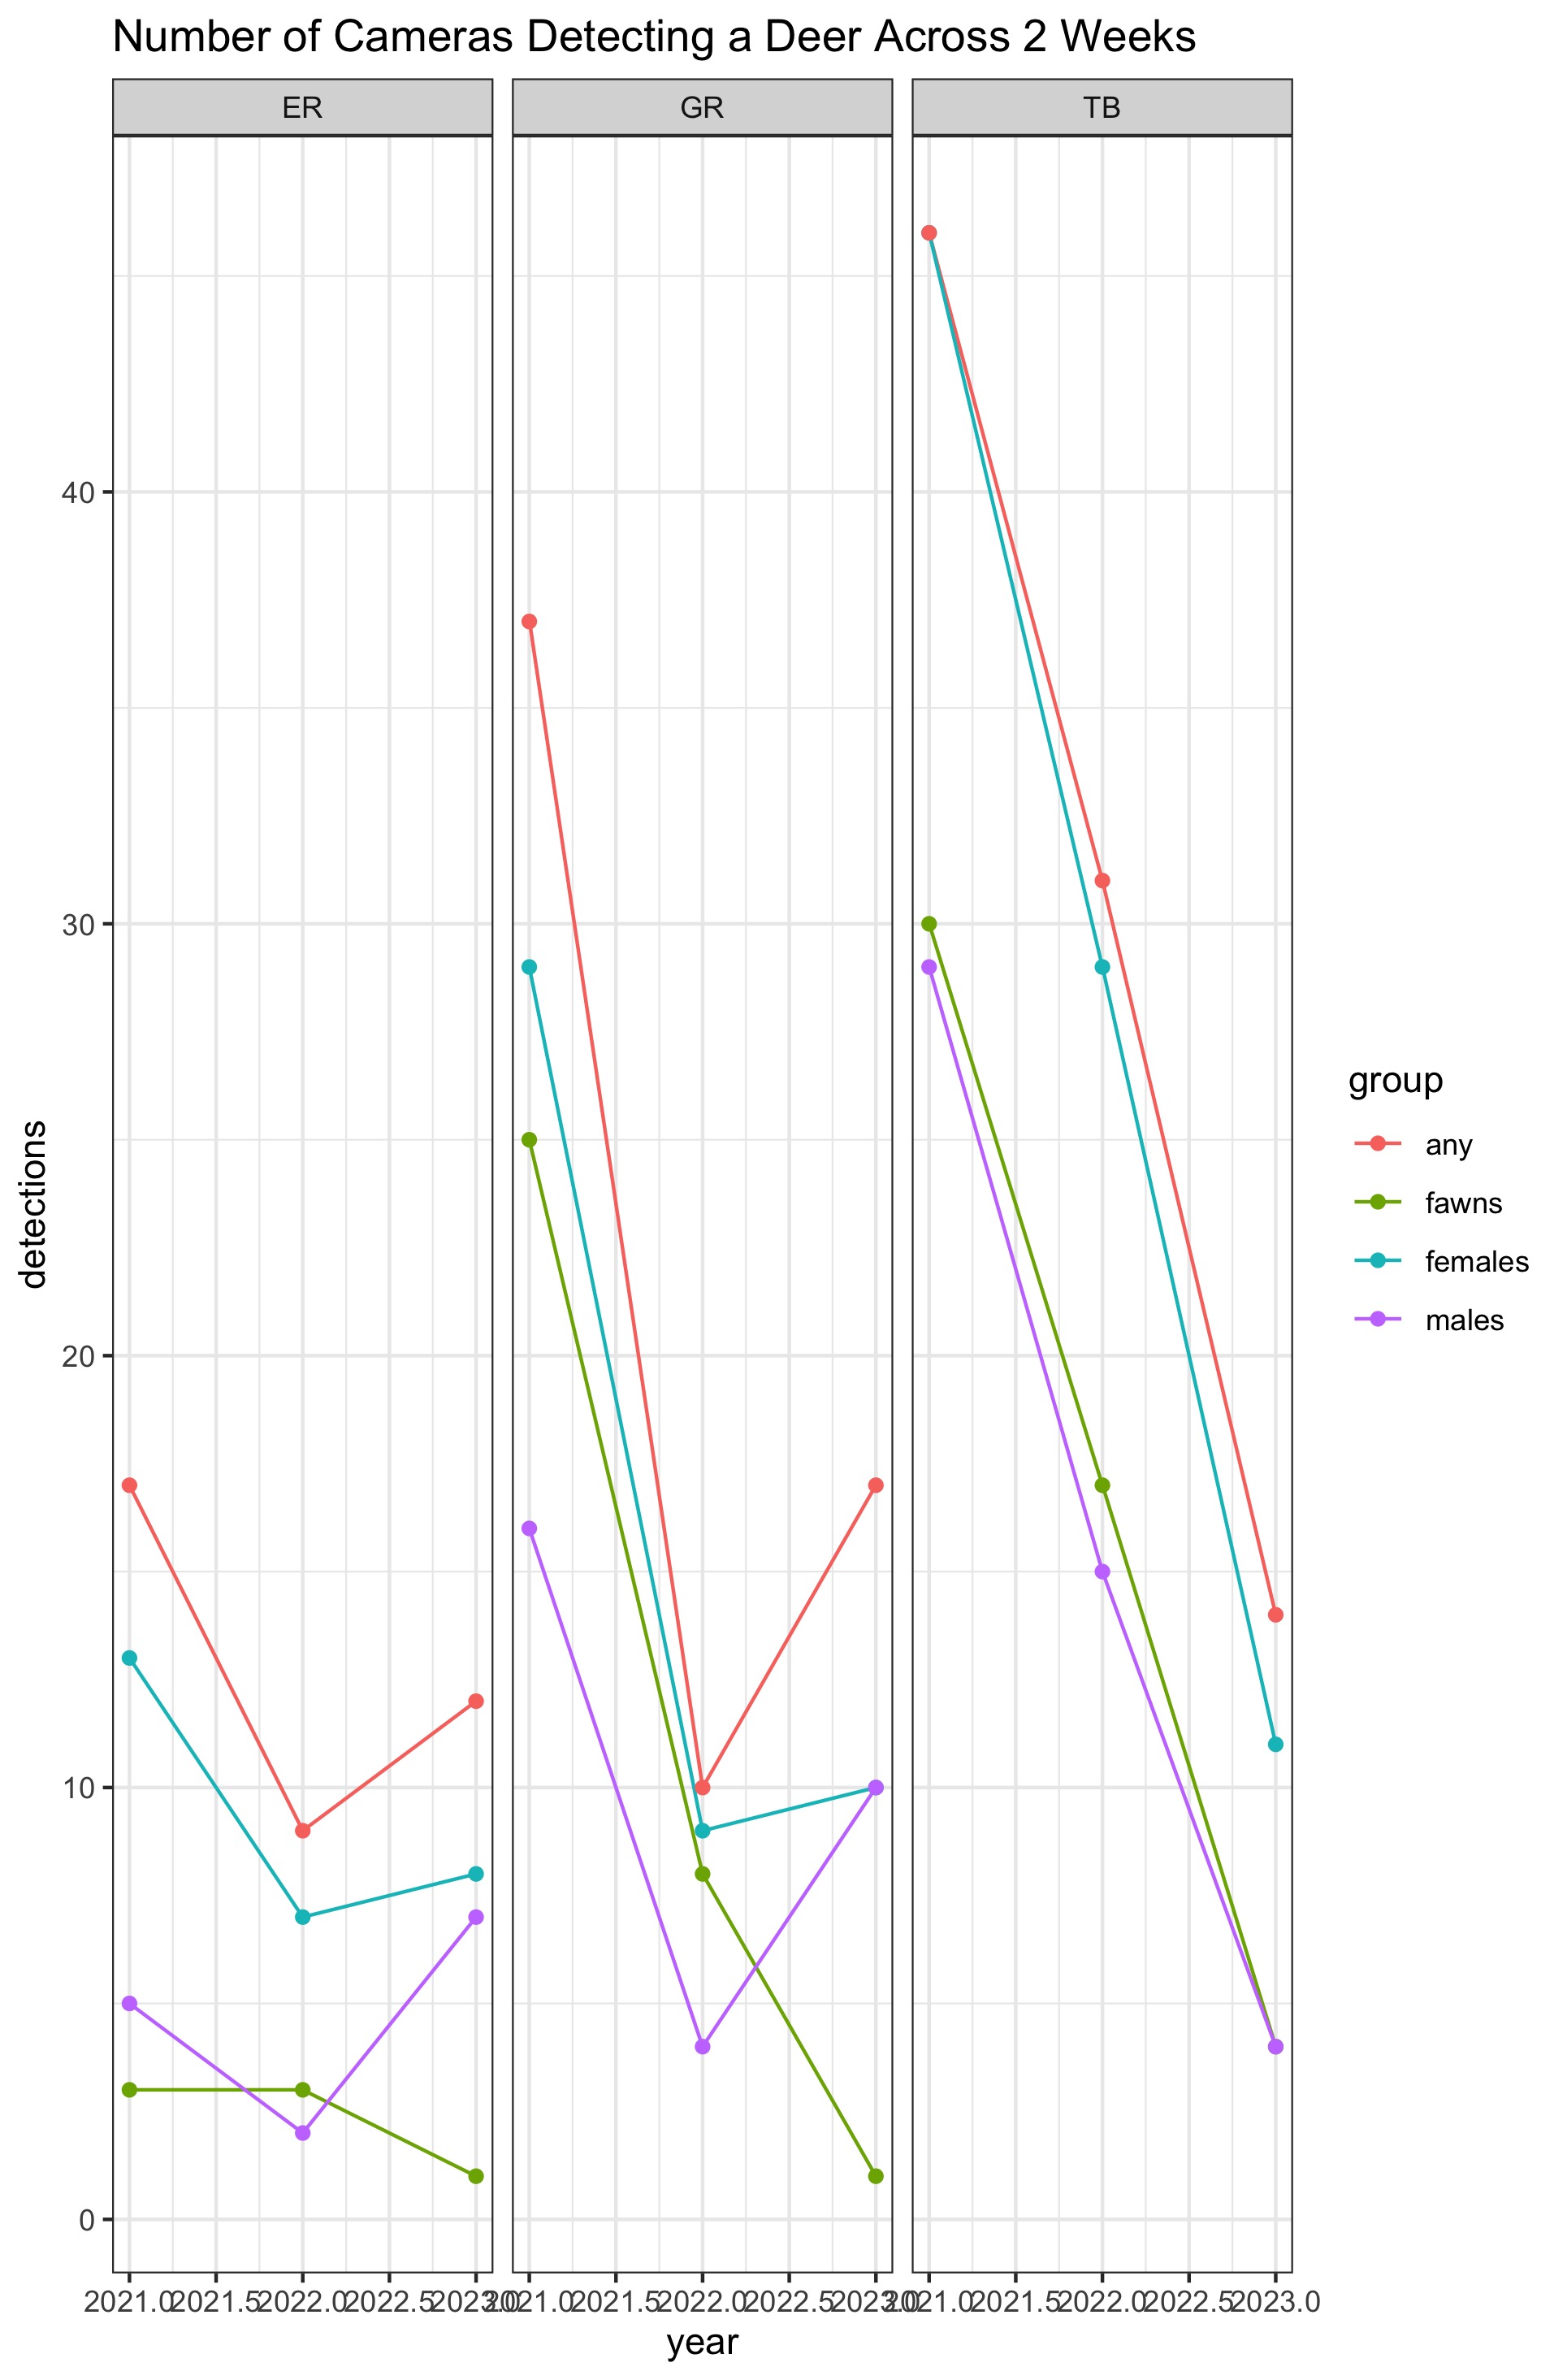
Crazy to watch #CWD crash a deer population so fast. It's rare that we see such a strong signal in raw data. In Year 1, 58% of our cameras detected at least one deer in a 2 week time frame. By Year 3, it's down to 17%. We'll have to see if Year 4 reveals the same pattern.
1
215
I thought I was coming into the office early to get extra work done, but apparently it was just so I can facetime my mother while she learns how her thermostat works🙄🙄
137

Heather Gaya, PhD retweeted

Looking to create stunning, data-rich maps in R? The tidyterra package makes it simple to integrate spatial data with ggplot2, bringing the power of the tidyverse to geospatial analysis. With tidyterra, you can work with spatial data just like any other data set in ggplot2.
✔️ Ease of Use: Simplifies map creation by integrating with ggplot2, using familiar functions and syntax, which reduces the complexity of working with spatial data.
✔️ Flexible Visualizations: Supports a variety of geospatial formats, allowing you to combine spatial data with other data sets, and work seamlessly with both raster and vector data.
✔️ Efficient Data Handling: Leverages dplyr-like functions for filtering, summarizing, and joining, which streamlines data processing and enables smooth integration between spatial and non-spatial data.
✔️ Beautiful Maps: Create detailed, customizable maps with less code and more flexibility, using the grammar of graphics you already know from ggplot2.
The visualizations shown here are taken from the package website and demonstrate how tidyterra simplifies creating detailed maps using ggplot2: dieghernan.github.io/tidyter…
If you’d like to learn more about ggplot2 and how to create stunning visualizations, check out my online course on “Data Visualization in R Using ggplot2 & Friends,” starting on November 25, 2024! See this link for additional information: statisticsglobe.com/online-c…
#RStats #Data #datascienceeducation #ggplot2 #StatisticalAnalysis #datavis #RStudio #DataViz

Say you're modeling unmarked camera trap data to get abundance, e.g: n_obs ~ dpois(encounter_rate*N). How does your cutoff threshold for 'independent' photos affect abundance? Has anyone tested this? I imagine it changes by species, but I need a reasonable cut off time for deer
2
3
363
My hunch is that there's some lower threshold that induces bias if the cut off is below and a similar issue for way too high. But if you have collar data/ear tags + run a 2-stage model to get priors for encounter rate and sigma, I suspect the threshold can be mostly arbitrary.
2
74


