

Experienced technical analyst with a passion for deciphering market trends. Using charts and indicators to navigate the world of finance. #TechnicalAnalysis
Atlanta, Georgia
Joined June 2020
- Tweets4.2K
- Following586
- Followers1.3K
- Likes23.9K




Pinned Tweet
Disclaimer: The content shared on this account is for informational purposes only and should not be considered as financial advice. Always do your own research and consult with a professional before making any investment decisions. #NotFinancialAdvice


$AAPL Boom!


$AAPL — Watching for Another Potential Short
Apple's price behavior on the four-hour chart appears to be shifting slightly, so I'm keeping a close eye on how this develops.
I'm watching for another potential short opportunity near the upper boundary of the ascending trendline structure, where selling pressure could emerge once again.
The change in price behavior could imply additional strength, so I'll be looking for confirmation of resistance before committing to another short.
We'll see if this setup can deliver one more time.

$INTC aggressive sell-off, beyond the heavy operational drag, is also driven by: institutional options activity, derivative unwinding, and stop-loss liquidations.
$TSLA & $AAPL — Two More Profitable Setups! 💰
Another couple of successful trades from the Goat Media Invest livestream!
We've continued to identify solid trading opportunities with clearly defined support and resistance levels, potential entries, exits, and risk management.
Just wanted to highlight two of the smaller setups I shared recently: Tesla ($TSLA) and Apple ($AAPL).
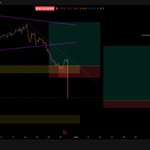
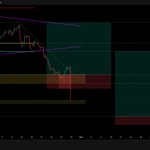
Both trades have now played out, delivering approximately 3:1 reward-to-risk opportunities. While those initial targets have been reached, both positions could still offer additional downside for anyone continuing to manage an open position.
Nothing flashy, just solid setups, patience, and execution.
Congratulations to everyone who rocked with me on these two trades! 🔥
More opportunities ahead. Let's keep protecting capital and finding those setups!
Goat Media Invest | Stocks & Crypto Live


$AAPL — Watching for Another Potential Short
Apple's price behavior on the four-hour chart appears to be shifting slightly, so I'm keeping a close eye on how this develops.
I'm watching for another potential short opportunity near the upper boundary of the ascending trendline structure, where selling pressure could emerge once again.
The change in price behavior could imply additional strength, so I'll be looking for confirmation of resistance before committing to another short.
We'll see if this setup can deliver one more time.
$AAPL — Watching for Another Potential Short
Apple's price behavior on the four-hour chart appears to be shifting slightly, so I'm keeping a close eye on how this develops.
I'm watching for another potential short opportunity near the upper boundary of the ascending trendline structure, where selling pressure could emerge once again.
The change in price behavior could imply additional strength, so I'll be looking for confirmation of resistance before committing to another short.
We'll see if this setup can deliver one more time.
$NOW ServiceNow — Post-Earnings Update | Watching $107.71–$98.78
ServiceNow has now lost the first potential support level I highlighted yesterday. As price approaches the next area between $107.71 and $98.78, I'm watching for signs that the selling pressure may begin to slow.
There's quite a bit of technical confluence within this region.
We're approaching the Point of Control (POC) of the broader consolidation range, accompanied by multiple significant volume shelves. The ascending resistance trendline I discussed yesterday has now been extended into a channel, with its lower boundary aligning with this same area.
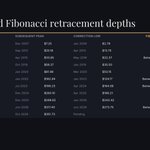
We also have the GP/ 0.786 Fibonacci retracement, , and the yearly VWAP adding to the potential support confluence.
This doesn't mean a bottom is confirmed. I'm looking for price action to begin slowing down and consolidating within this region before gaining confidence that buyers can defend it.
For now, $107.71–$98.78 is the next area of interest, and how price behaves here will help determine whether we're seeing stabilization or another continuation lower.


$NOW ServiceNow — Sell-Off Underway | Watching Support Levels
As I discussed during the livestream, I was anticipating a potential sell-off in ServiceNow. Price was looking increasingly extended, and I highlighted an ascending resistance level on the chart that added to my concerns.
We're now seeing that selling pressure develop, with price reaching the first area of potential support I identified.
There are two additional support levels below that I'm monitoring if the decline continues.
For now, I want to see how the market reacts when trading resumes tomorrow and allow some time for the sell-off to be digested before drawing further conclusions.
I'll revisit all three support levels and discuss the potential scenarios in more detail during tomorrow's livestream.


$GOOGL — Additional Update | One More Potential Support Scenario
Google has now dropped into the next area of interest, but there's one additional scenario I'm keeping on the radar.
Price has lost nearly every significant support level I've been monitoring, with one notable exception: the monthly mean-reversion level near $272.
What makes this area interesting is the confluence of three technical factors:
Monthly mean reversion near $272
Prior weekly support in the same region
Approximately 50% Fibonacci retracement
That gives us another potential area where buyers could attempt to establish support if the current level fails.
Beyond that, Google's decline would be getting too extended for the type of long opportunity I'm interested in pursuing, and I'd be stepping away from the setup.
For now, I'm not rushing into another entry. I'll reassess tomorrow after the market has had time to digest the earnings news and look for signs of price stabilization and consolidation before considering any position.

$GOOGL — Trade Update | Original Setup Failed
Google's earnings coming in below expectations have caused my original long setup to fail.
Price is now attempting to hold another support area that I highlighted during the livestream. While this level could potentially offer a reaction, I'm not looking to take a position here at this time.
I'm still watching the second setup I previously discussed, with the $287 region remaining an area of interest for a possible long opportunity.
I'll reassess tomorrow after the market has had more time to digest the earnings news and price action. There's no reason to rush into another position without seeing how the structure develops.
I'll share another update as the picture becomes clearer.

$NOW ServiceNow — Sell-Off Underway | Watching Support Levels
As I discussed during the livestream, I was anticipating a potential sell-off in ServiceNow. Price was looking increasingly extended, and I highlighted an ascending resistance level on the chart that added to my concerns.
We're now seeing that selling pressure develop, with price reaching the first area of potential support I identified.
There are two additional support levels below that I'm monitoring if the decline continues.
For now, I want to see how the market reacts when trading resumes tomorrow and allow some time for the sell-off to be digested before drawing further conclusions.
I'll revisit all three support levels and discuss the potential scenarios in more detail during tomorrow's livestream.
$GOOGL — Trade Update | Original Setup Failed
Google's earnings coming in below expectations have caused my original long setup to fail.
Price is now attempting to hold another support area that I highlighted during the livestream. While this level could potentially offer a reaction, I'm not looking to take a position here at this time.
I'm still watching the second setup I previously discussed, with the $287 region remaining an area of interest for a possible long opportunity.
I'll reassess tomorrow after the market has had more time to digest the earnings news and price action. There's no reason to rush into another position without seeing how the structure develops.
I'll share another update as the picture becomes clearer.
$GOOGL — Long Position Opened
I've entered a long position in Google, looking for a potential recovery toward $360, provided the current support region holds.
Price is attempting to bounce from the weekly 28-period mean-reversion level, with a nearby consolidation area offering additional potential support.
GOOGL recently broke below its wedge structure and lost the value area low, accompanied by an expansion in the daily Bollinger Bands. That expansion remains in place, so downside volatility is still a concern.
My initial take-profit area is the previous value area low, with $360 serving as an extended target if the recovery gains traction. The full target remains in play, but I'll be watching price action at the first take-profit level before deciding how much of the position to carry higher.
With earnings scheduled for Wednesday after the close, this is a higher-risk entry. I'm managing the position with a trailing stop in case selling pressure returns.
If support fails, $287 is my next area of interest for reassessing a possible long entry, depending on how the chart develops.
This is a conditional trade, not a prediction. New price action will determine how I manage it.
NFA


$BA Boeing — Watching a Potential Long Opportunity Ahead of Earnings
Boeing reports earnings tomorrow, October 27, before the market opens. With that event approaching, I'm not suggesting taking a position ahead of the announcement, but I am watching an interesting technical setup on the monthly chart.
Price is attempting to defend the value area low of a smaller consolidation range. If that support fails, we could see another rotation lower toward an ascending trendline that has repeatedly aligned with the Fibonacci platinum pocket (0.786–0.886 retracement).
That's where I'd be interested in reassessing a potential long entry, provided price action supports the setup.
The upside opportunity would be a recovery toward the upper boundary of the monthly consolidation range, an area where Boeing has previously struggled to sustain upside momentum.
For now, I'm treating this as a potential range trade rather than anticipating a major bullish breakout. I'll consider a more bullish scenario only if Boeing can break above that consolidation range.
Earnings could significantly change the technical picture, so patience and confirmation will matter here.

$SPCX— Trade Update | No Position Taken
As I shared during the livestream, I did not take the entry I was watching near the value area low. I was willing to consider a long position if price pulled back toward $140, but that opportunity never developed.
Instead, price found support once again around the Point of Control (POC) and value area low, and we're now seeing another move higher from that region.
At this point, I have no plans to enter a SpaceX position. The setup I was looking for didn't materialize, and I'm not interested in chasing price higher.
I'll reassess if a new opportunity develops.

$GOOGL — Long Position Opened
I've entered a long position in Google, looking for a potential recovery toward $360, provided the current support region holds.
Price is attempting to bounce from the weekly 28-period mean-reversion level, with a nearby consolidation area offering additional potential support.
GOOGL recently broke below its wedge structure and lost the value area low, accompanied by an expansion in the daily Bollinger Bands. That expansion remains in place, so downside volatility is still a concern.
My initial take-profit area is the previous value area low, with $360 serving as an extended target if the recovery gains traction. The full target remains in play, but I'll be watching price action at the first take-profit level before deciding how much of the position to carry higher.
With earnings scheduled for Wednesday after the close, this is a higher-risk entry. I'm managing the position with a trailing stop in case selling pressure returns.
If support fails, $287 is my next area of interest for reassessing a possible long entry, depending on how the chart develops.
This is a conditional trade, not a prediction. New price action will determine how I manage it.
NFA

Congrats if you rocked with me on the $HD play.

I’m taking a little bit of risk here on Home Depot.
One thing that caught my attention is the pattern $HD has been following during this downtrend from the upper $400s.
It’s been roughly three months down, followed by a correction back to the upside into the golden pocket.
Three months down → golden pocket retracement.
Three months down → golden pocket retracement.
And now we’ve just completed another three-month move to the downside, and we’re starting to see a green monthly candle form at a pretty significant area.
This zone has history. It has acted as support multiple times for Home Depot, and if you go all the way back to 2020, it also acted as resistance before eventually being broken.
There are a few other things lining up here as well. I’m watching some rising diagonal trend lines that could provide additional support, along with the standard deviation 1 level sitting in this general area.
None of that guarantees the pattern repeats. I’m simply looking at the structure and saying there are enough things coming together here for me to take a little bit of risk.
If it works, I’ll manage the move as it develops. If the setup gets invalidated, I’ll close the trade.
Just wanted to share what I’m seeing here on Home Depot and why I’m willing to take the trade.

ethereum:0x4a220e6096b25eadb88358cb44068a3248254675 (Quant) | Potential Bullish Setup Developing
QNT could be setting up for a bullish move to the upside, and there are a few things on the chart that have caught my attention.
Starting with market structure, QNT appears to be developing a potential inverse head and shoulders pattern, with the head forming around $182.65. We're also seeing some bullish divergence on the RSI, which could suggest that selling pressure is beginning to weaken.
However, there is also some bearish divergence present, so we're getting mixed signals at the moment.
On top of that, QNT is currently in a tight Bollinger Band squeeze, consolidating between two important levels:
$204.61 — Previous resistance
$182.65 — Previous support
These levels are defining the current range, and I'll be watching for price to show some meaningful follow-through before getting too excited about a potential breakout.
There are also two descending trend lines that I'm paying close attention to.
The first descending trend line is important because a breakout above it could signal that price is beginning to overcome the weakness associated with the bearish divergence.
The second descending trend line is another potential obstacle. This one lines up with some previous lows that could act as resistance, and it's also sitting roughly around the value area low of a previous trading range.
That gives us some additional confluence in that area, which means even if QNT manages to break through the first trend line, it could still run into resistance at the second.
So while the potential inverse head and shoulders, bullish RSI divergence, and tight squeeze make this an interesting setup, we still need confirmation from price action.
I've also marked several additional levels and potential targets on the chart. The more significant levels are highlighted with colored lines rather than white lines, so pay particular attention to those.
For now, I'm watching how QNT responds to the descending trend lines, whether it can challenge the $204.61 resistance level, and whether the potential bullish structure continues to develop.
I'll provide another update when I notice a meaningful change in the chart or when price action gives us something new to work with.
As always, this is not financial advice. I'm simply sharing what I'm seeing on the chart and the levels I'm watching.


