

In crypto since 2019 | Alpha Research | I print while they cope.
Join my TG →
Joined November 2024
- Tweets6.1K
- Following136
- Followers4.8K
- Likes14.4K
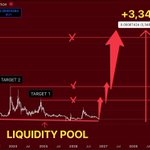






$LUNC is trading around $0.0000358.
After years of lower highs and selling pressure, $LUNC is back near its historical liquidity zone.
And the weekly chart is showing a potential reversal setup.
The projected upside? +3,348%.
My targets:
$0.00017645 — Target 1
$0.00027745 — Target 2
$0.00064305 — Target 3
$0.00070+ — Extreme bull scenario.
First, buyers need to reclaim $0.00005 and confirm a bullish shift in market structure.
The projection is highly speculative, and the current support could still break.
But if this liquidity zone holds, $LUNC could be setting up for another major rally.

$INJ is trading around $6.91.
After reaching above $50 in 2024, $INJ spent years correcting before returning to its historical discount zone.
Now the weekly chart is showing a potential recovery setup.
The projected upside? +3,051% from the marked historical base.
My targets:
$16.329 — Target 1
$35.230 — Target 2
$52.858 — Target 3
$75+ — Extreme bull scenario.
First, buyers need to reclaim $10 and establish higher lows on the weekly chart.
The projection is highly speculative, and losing support could trigger another decline.
But if this discount zone holds, $INJ could be preparing for another major expansion.

$NEAR is trading around $3.20.
And this weekly chart is showing a potentially massive long-term setup.
After reaching $20 in 2022, $NEAR experienced years of corrections and failed recoveries.
Now price is approaching a key historical discount zone.
The chart projects a potential +5,349% rally from its marked historical base.
My targets:
$3.293 — Target 1
$8.909 — Target 2
$20.644 — Target 3
$30+ — Extreme bull scenario.
First, buyers need to reclaim $3.293 and confirm a bullish shift in market structure.
The projection is highly speculative, and losing support could trigger further downside.
But if this discount zone holds, $NEAR could be setting up for another major cycle.

$FET is trading around $0.132.
And this weekly chart is showing a fascinating long-term pattern.
Look at the previous market cycles.
In 2021, $FET experienced its first major bullish expansion.
Then in 2024, buyers returned and pushed price above $3, establishing a new all-time high.
Now, after years of selling pressure, $FET is trading near its historical lows again.
But here's what caught my attention.
The chart connects previous cycle peaks with a rising trendline, pointing toward a potential third major expansion.
The extreme projection shows +10,258% from its marked historical base.
Here's my roadmap:
$0.30 — First resistance.
$0.50 — Recovery checkpoint.
$1.00 — Psychological milestone.
$2.00 — Major resistance.
$3.50 — Previous cycle high region.
$5.00 — Aggressive continuation.
$7.00 — Extreme bull scenario (ATH 3).
But first, buyers need to reclaim $0.30 and establish higher lows on the weekly timeframe.
Without a confirmed reversal, further downside remains possible.
The $7 target is highly speculative. A rising line connecting historical peaks doesn't guarantee another rally.
Still, if $FET manages to reverse its long-term downtrend, the next cycle could become interesting.
Two major expansions are behind us.
Could a third one eventually follow?

$TIA is trading around $0.356.
And this weekly chart is showing a potentially massive long-term reversal setup.
Back in 2024, $TIA surged above $20.
What followed was a brutal collapse.
Lower highs. Failed recoveries. Years of selling pressure.
Now price is trading more than 98% below its previous peak.
But here's what caught my attention.
$TIA is approaching a major historical discount zone after an extended period of declining prices.
The chart projects a potential 8,918% expansion from its marked historical base.
Here's my roadmap:
$1 — First major resistance.
$2 — Recovery checkpoint.
$5 — Important structural level.
$9.2410 — Target 1.
$11.8911 — Target 2.
$21.1260 — Target 3.
$30+ — Extreme bull scenario.
But first, buyers need to establish higher lows and reclaim $1 with strong buying volume.
A sustained breakout above $2 would strengthen the bullish case.
Until then, the broader downtrend remains a significant risk.
The 8,918% projection is extremely speculative, especially considering potential token supply expansion.
But if this historical discount zone holds, $TIA could be approaching an important turning point.
The question isn't whether a 90x rally is guaranteed.
It's whether buyers are finally ready to reverse the trend.

$QNT is trading around $154.
And this weekly chart is showing a potentially massive bullish setup.
Look at the bigger picture.
After years of consolidation, $QNT experienced a powerful breakout, pushing above $350 before correcting sharply.
But here's what caught my attention.
Price is now approaching a critical price balance zone, where buyers could attempt to establish a new support base.
The chart also highlights a potential rising channel that could develop if bullish momentum returns.
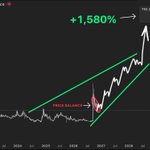
And the projected upside? +1,580%.
Here's my roadmap:
$200 — First resistance to reclaim.
$250 — Important recovery checkpoint.
$350 — Previous major high region.
$500 — Bullish continuation target.
$600 — Upper channel resistance.
$800–850 — Extreme bull scenario.
But first, buyers need to defend the $150 region and establish higher lows.
A sustained breakout above $200–250 with strong volume would strengthen the bullish case.
Losing the current support zone would weaken this setup considerably.
The 1,580% projection is highly speculative and measured from the chart's historical reference point, not today's price.
Still, if $QNT successfully turns this price balance zone into support, the next bullish expansion could become significant.
The structure is developing.
Now buyers need to prove they're ready.

$PIEVERSE is trading around $1.90.
And this daily chart is showing a bullish structure that could become very interesting.
Look at the bigger picture.
Earlier in 2026, $PIEVERSE spent months trading below $1.
Price was moving sideways.
Volatility was relatively low.
And every attempt to establish bullish momentum eventually faded.
But something started changing in June.
Look at the highlighted structure.
Price began forming gradually higher lows while the upper boundary of the consolidation range continued rising.
Buyers were becoming more aggressive.
Selling pressure was being absorbed.
And the market started building a foundation for a potential breakout.
Then came September.
$PIEVERSE pushed toward $2 before experiencing another significant correction.
But here's what caught my attention.
Instead of collapsing back toward its previous lows, price began recovering again.
And the recent structure suggests that buyers are attempting to regain control.
Could this be the beginning of another major bullish expansion?
Possibly. But the breakout still needs confirmation.
Here's my roadmap.
$2.00 — First psychological resistance.
$2.50 — Important breakout checkpoint.
$3.00 — Major continuation target.
$3.50 — Previous projected resistance zone.
$4.00–4.50 — Aggressive bullish expansion area.
$5.00 — Important psychological milestone.
And $6? That's my extreme bull scenario.
But here's why I'm paying attention.
The chart shows a prolonged period of consolidation followed by a gradual increase in buying pressure.
Higher lows began developing.
Price started challenging previous resistance levels.
And the broader structure transitioned from sideways movement into a potential bullish trend.
That's exactly the kind of structural change I like to monitor.
Still, there's a major difference between a potential breakout and a confirmed bullish continuation.
First, I want to see $PIEVERSE reclaim $2 and hold above it.
A sustained breakout above $2.50 with expanding volume would strengthen the bullish thesis.
And a decisive move through $3 would suggest that buyers are gaining momentum.
Without those confirmations, another rejection remains possible.
The $1.50 region is particularly important to watch.
If price loses that area and fails to recover, the bullish structure would weaken considerably.
But think about the market psychology.
Earlier this year, $PIEVERSE was trading around $0.50.
Now it's approaching $2.
The market has already demonstrated that strong expansions can emerge after extended periods of consolidation.
And if buyers continue establishing higher lows, the next bullish leg could become significant.
The projected trendline suggests that $6 could become a long-term upside objective.
But that projection is speculative, not a guaranteed outcome.
And reaching $6 from the current $1.90 region would represent approximately a 216% increase.
I'm watching whether $PIEVERSE can turn its developing buyer pressure into a sustained bullish breakout.
Because the strongest trends don't begin with a massive green candle.
They begin when buyers gradually take control of the market structure.
And $PIEVERSE is definitely a chart worth watching.

5
548
First, I want to see $NEAR defend its current support region
and establish a clear sequence of higher lows.
A sustained weekly reclaim of $5 would be the first encouraging signal.
Breaking above $7–10 with expanding volume would strengthen the bullish thesis considerably.
And a decisive move above $20 would represent a major structural shift, potentially opening the door to price discovery.
Without those confirmations, the broader bearish structure remains a significant risk.
There's also something important to understand about the projection.
The 9,024% measurement is calculated from the chart's marked historical base, not the current $2.94 price.
And reaching $90–100 would require extraordinary market conditions, sustained demand, and a massive expansion in market capitalization.
But think about the market psychology.
In 2022, traders were chasing $NEAR above $20.
In 2024, excitement returned as price approached $9.
Now it's trading below $3.
The excitement has faded.
Momentum has weakened.
And price is sitting near a region that has repeatedly attracted buyers throughout its history.
That doesn't automatically mean the bottom is in.
But if buyers successfully defend this long-term liquidity zone and begin breaking the sequence of lower highs, the next expansion could become significant.
The $90–100 projection is extremely speculative, not a guaranteed outcome.
I'm not blindly expecting a 90x rally.
I'm watching whether this multi-year consolidation structure can finally transition into a sustained bullish trend.
Because the biggest market expansions don't begin with everyone agreeing that prices will go higher.
They begin when the market structure starts changing, and buyers gradually regain control.
And $NEAR is definitely a chart worth watching.

$SEI is trading around $0.039.
And this weekly chart is showing one of the most extreme long-term setups in the altcoin market.
Look at the bigger picture.
Back in 2024, $SEI experienced a massive bullish expansion, pushing above $1.10.
The momentum was explosive.
Buyers were aggressively entering the market, and every breakout attracted more attention.
Then everything changed.
Lower highs. Failed recoveries. Nearly two years of relentless selling pressure.
And now price is trading more than 96% below its previous major high.
But here's what caught my attention.
$SEI has returned to a massive historical liquidity zone, near the same region where its previous major bullish expansion began.
And after such an extended decline, price is consolidating near the bottom of its multi-year trading range.
Could this be the foundation for another explosive rally?
Possibly. But buyers still need to confirm it.
Here's my roadmap.
$0.10 — First resistance to reclaim.
$0.20 — Important recovery checkpoint.
$0.39050 — First major target.
$0.73460 — Second target.
$1.14196 — Third target and previous major high.
$1.50 — Potential breakout continuation.
And $2.10? That's my extreme bull scenario.
The chart illustrates a potential 5,900% expansion from its marked historical reference point.
That's almost a 60x move.
An extraordinary projection.
But here's what makes this setup particularly interesting.
The weekly chart shows three major historical resistance levels.
Each one represents a previous region where sellers managed to regain control.
And if buyers eventually reclaim these levels, the broader market structure could begin changing dramatically.
Still, there's a major difference between a potential accumulation zone and a confirmed bullish reversal.
First, I want to see $SEI defend its current base and establish a clear sequence of higher lows.
A sustained weekly reclaim of $0.10 would be an encouraging first signal.
Breaking above $0.20 with expanding volume would strengthen the case for a larger recovery.
And a decisive move above $0.39050 would represent a meaningful shift in the broader bearish structure.
Without those confirmations, the market could continue making new lows.
There's also something important that cannot be ignored.
Token unlocks and circulating supply growth could create additional selling pressure, meaning a return to previous highs may require substantially more capital than before.
But think about the market psychology.
In 2024, traders were chasing $SEI above $1.
Now it's trading below $0.04.
The excitement has disappeared.
Momentum has collapsed.
And almost nobody wants to talk about the possibility of another major rally.
That's exactly why I'm watching this chart.
Not because a 96% correction automatically makes something a good investment.
And not because every historical support level eventually produces an explosive recovery.
But because prolonged consolidation near historical lows can sometimes become the starting point of a completely new market structure.
If buyers successfully defend this liquidity zone and begin breaking the sequence of lower highs, the next expansion could become significant.
The 5,900% projection is an extremely speculative scenario, not a guaranteed outcome.
I'm not blindly expecting a 60x rally.
I'm watching whether $SEI can turn this multi-year decline into a genuine accumulation phase.
Because the market doesn't need everyone to believe in a reversal.
It needs buyers to start proving one.

$BTC is trading around $66,650.
And this weekly chart is showing a bearish structure that could become very important heading into December.
Look at the bigger picture.
After an explosive bull run that pushed Bitcoin above $120,000, the market entered a major correction.
The momentum that previously carried BTC to new highs has disappeared.
Lower highs. Failed recoveries. Increasing selling pressure.
And now the weekly structure is starting to look increasingly vulnerable.
But here's what caught my attention.
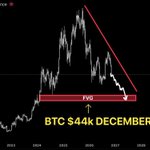
There's a major fair value gap sitting between approximately $43,000 and $48,000.
An imbalance that has remained on the weekly chart since Bitcoin's previous major expansion.
And price is now moving toward that region.
Could this be where the next major correction ends?
Possibly.
Here's my bearish roadmap.
$65,000 — Immediate support to watch.
$60,000 — First major psychological level.
$55,000 — Important downside checkpoint.
$48,000 — Upper boundary of the weekly FVG.
$44,000 — My primary bearish target for December.
That's roughly another 34% decline from the price shown on this chart.
But here's why this setup is interesting.
Bitcoin has already formed a sequence of lower highs following its previous major peak.
Every recovery attempt has struggled to regain bullish momentum.
And the descending resistance line continues to define the broader bearish structure.
As long as buyers fail to reclaim these important levels, the risk of another significant move lower remains.
Now look at the weekly FVG.
This region represents a previous area of aggressive price displacement.
Markets don't have to revisit every imbalance.
But when a strong trend begins reversing, these unfinished price regions can become important areas to monitor.
And right now, the $44,000 region stands out.
Still, I wouldn't expect Bitcoin to move there in a straight line.
We could see temporary recoveries, short squeezes, and multiple attempts to reclaim lost support before any deeper correction.
The level that matters to me is $70,000.
If BTC manages to reclaim that region and establish a convincing higher high, the immediate bearish scenario becomes weaker.
A sustained recovery above $85,000 would challenge the broader downside thesis much more seriously.
But until the weekly structure changes, I'm keeping the $44,000 scenario on my radar.
And here's something worth remembering.
At the highs, everyone was focused on how far Bitcoin could climb.
Now the more important question might be how much liquidity the market needs to absorb before a sustainable recovery can begin.
The $44,000 target isn't guaranteed.
And the December timing is a speculative projection, not a confirmed outcome.
But the combination of lower highs, declining momentum, and an unfilled weekly FVG makes this a scenario worth monitoring.
I'm watching the reaction around $60,000 first.
If that level fails, the path toward $48,000–$44,000 becomes increasingly interesting.

$PEPE is trading around $0.00000428.
And this weekly chart is showing something that looks remarkably similar to the structure that preceded its previous explosive rally.
Look at what happened in 2023.
$PEPE spent months consolidating near its historical lows.
Volatility was compressed.
Price barely moved.
And most traders weren't paying attention.
Then everything changed.
In 2024, $PEPE entered an explosive bullish expansion, delivering a massive 2,334% rally in just 294 days.
Price eventually reached its all-time high near $0.0000283.
But what followed was a brutal correction.
Lower highs. Failed recoveries. Months of relentless selling pressure.
Now here's what caught my attention.
After losing more than 80% of its value, $PEPE has returned to another major consolidation zone.
And the similarities between these two structures are difficult to ignore.
Accumulation Zone 1 preceded the massive 2024 rally.
Accumulation Zone 2 is developing near the current historical lows.
Could the market be preparing for another expansion?
Possibly. But buyers still need to confirm it.
Here's my roadmap.
$0.0000055 — First resistance to reclaim.
$0.0000075 — Important breakout checkpoint.
$0.000010 — Psychological resistance.
$0.000016 — Major historical supply zone.
$0.0000283 — Previous all-time high.
And $0.000050? That's my extreme bull scenario.
The chart illustrates a potential 2,425% expansion from its marked historical base.
That's more than a 25x move.
An extremely aggressive projection.
But here's what makes this setup interesting.
The previous 2,334% rally didn't begin with a massive breakout candle.
It began with months of sideways price action.
A prolonged period of consolidation.
And eventually, a decisive shift in buying momentum.
Now $PEPE is showing another extended consolidation structure near its lows.
Still, there's a major difference between a potential accumulation phase and a confirmed bullish reversal.
First, I want to see $PEPE establish higher lows and reclaim $0.0000055 on the weekly timeframe.
A sustained breakout above $0.0000075 with expanding volume would provide stronger evidence that buyers are regaining control.
Without those confirmations, the current range could simply be a pause within the broader downtrend.
But think about the market psychology.
In December 2024, traders were aggressively chasing $PEPE near its all-time high.
Now it's trading around $0.00000428.
The excitement has faded.
Volatility has contracted.
And the market is consolidating inside another historically significant price region.
That doesn't automatically mean the bottom is in.
But if buyers successfully defend this second consolidation zone and begin breaking the sequence of lower highs, the next expansion could become very interesting.
The 2,425% projection is highly speculative, not a guaranteed outcome.
I'm not assuming history will repeat itself.
I'm watching whether the same type of market structure that preceded the previous 2,334% rally is developing once again.
Because sometimes the most explosive moves begin when the market looks completely dead.

$LUNC is trading around $0.0000366.
And this weekly chart is showing a massive long-term structure that has been developing for years.
Look at the bigger picture.
Since the collapse in 2022, $LUNC has experienced one of the most prolonged bearish trends in the crypto market.
Lower highs. Failed recoveries. Years of persistent selling pressure.
Every major rally eventually faced another aggressive rejection.
But here's what caught my attention.
After years of declining prices, $LUNC has returned to a major historical discount zone.
And this isn't the first time buyers have attempted to defend this region.
In late 2023, $LUNC experienced a significant rally from its lows.
Then in 2024, another recovery attempt pushed price toward $0.00018.
Both moves were eventually rejected.
And now the market is back near the bottom of its multi-year trading range.
Could this be the beginning of another accumulation phase?
Possibly. But buyers still need to prove themselves.
Here's my roadmap.
$0.00005 — First resistance to reclaim.
$0.00010 — Important psychological checkpoint.
$0.00017645 — First major target.
$0.00027745 — Second target.
$0.00064305 — Third major target.
And $0.00069? That's my extreme bull scenario.
The chart illustrates a potential 2,000% rally from its marked historical reference point.
That's more than a 20x move.
An extremely aggressive projection.
But here's what makes this setup interesting.
$LUNC has spent years trading inside a broad declining structure, while major rallies have repeatedly emerged from relatively low price levels.
And now price is approaching another historically significant support region.
Still, there's a major difference between a potential accumulation zone and a confirmed bullish reversal.
First, I want to see $LUNC defend its current base and establish higher lows on the weekly timeframe.
A sustained reclaim of $0.00005 would be an encouraging first signal.
Breaking above $0.00010 with expanding volume would strengthen the case for a larger structural recovery.
Without those confirmations, the broader bearish trend remains intact.
There's also a critical factor that cannot be ignored.
$LUNC still has an enormous circulating supply.
Any major recovery would require substantial sustained demand, and future supply reductions alone cannot guarantee higher prices.
But think about the market psychology.
In previous cycles, traders were chasing $LUNC during aggressive short-term rallies.
Now it's trading near $0.0000366, with price compressed close to its historical lows.
Interest has faded.
Volatility has contracted.
And the market is once again testing a region that has previously attracted speculative demand.
That doesn't automatically mean the bottom is in.
But if buyers successfully defend this historical base and begin breaking the sequence of lower highs, the next recovery could become interesting.
The 2,000% projection is highly speculative, not a guaranteed outcome.
I'm watching whether this multi-year discount zone can become the foundation for a genuine bullish reversal.
Because the first sign of a new market cycle isn't a massive green candle.
It's a change in structure.


$FET is trading around $0.147.
And this weekly chart is showing something that could become very interesting.
Look at what happened in 2024.
After spending months consolidating near the lows, $FET entered an explosive bullish expansion.
Price surged above $3, turning one of the quietest periods on the chart into a massive rally.
Then everything changed.
Lower highs. Failed recoveries. Months of relentless selling pressure.
And now price has returned to almost the exact same historical region where the previous major expansion began.
But here's what caught my attention.
The weekly chart is showing two potential accumulation zones separated by an entire market cycle.
The first preceded the explosive rally in 2024.
And now $FET is consolidating inside another long-term discount region.
Could history be preparing to repeat itself?
Possibly. But buyers still need to confirm it.
Here's my roadmap.
$0.30 — First important resistance to reclaim.
$0.50 — Initial recovery checkpoint.
$0.9631 — First major target.
$2.1855 — Second target.
$3.4729 — Third target and previous major high.
And $5.40? That's my extreme bull scenario.
The chart illustrates a potential 4,621% expansion from its marked historical reference point.
That's a massive projection.
But here's why I'm paying attention.
$FET has already demonstrated how aggressively it can move when prolonged consolidation transitions into a strong bullish trend.
And the current price structure is approaching another historically significant region.
Still, there's a major difference between a potential accumulation zone and a confirmed bullish reversal.
First, I want to see buyers defend the current base and establish a sequence of higher lows.
A sustained weekly reclaim of $0.30 would be an encouraging first signal.
Breaking above $0.50 with expanding volume would strengthen the case for a larger recovery.
Without those confirmations, the broader bearish structure remains intact.
But think about the market psychology.
In 2024, traders were chasing $FET above $3.
Now it's trading below $0.15.
The excitement has faded, the momentum has disappeared, and the market looks completely different.
That doesn't automatically mean the bottom is in.
But some of the strongest historical expansions developed after extended periods when price appeared to be going nowhere.
The $5.40 projection is highly speculative, and reaching it would require extraordinary market conditions.
I'm not blindly expecting a 46x rally.
I'm watching whether this second historical pump zone can become the foundation for another major bullish cycle.
Because if buyers finally regain control, the next expansion could be worth paying attention to.

$NEAR is trading around $3.52.
And this weekly chart is showing one of the most ambitious long-term setups I've been watching.
Look at the bigger picture.
Back in 2022, $NEAR experienced an explosive rally, pushing above $20 before entering a brutal correction.
Then came years of volatility.
Lower highs. Failed recoveries. Extended periods of consolidation.
In 2024, buyers returned and triggered another significant expansion toward $9.
But once again, the market reversed.
Now here's what caught my attention.
Despite multiple market cycles, $NEAR has repeatedly returned to a major historical liquidity zone.
And that same long-term support region is still shaping the broader market structure.
Could this be the foundation for another massive expansion?
Possibly. But buyers still need to confirm it.
Here's my roadmap.
$5 — First resistance to reclaim.
$7–9 — Important historical supply zone.
$12–15 — Potential continuation targets.
$20–21 — Previous cycle highs.
$30–40 — Major breakout expansion zone.
$50–60 — Aggressive long-term targets.
And $90–95? That's my extreme bull scenario.
The chart illustrates a potential 6,765% rally from its marked historical reference point.
Yes, more than 60x.
That's an extraordinary projection.
And reaching those levels would require a complete transformation of the long-term market structure, sustained institutional and retail demand, and a massive expansion in overall market liquidity.
But here's what makes this chart particularly interesting.
$NEAR has already demonstrated its ability to produce significant rallies after extended consolidation periods.
And the current structure shows another potential attempt to transition from accumulation into expansion.
Still, a historical liquidity zone alone doesn't guarantee a bullish reversal.
First, I want to see $NEAR establish higher lows and reclaim the $5 region with convincing weekly momentum.
A sustained breakout above $7–9 would provide much stronger evidence that buyers are regaining control.
Only then would I start taking the larger upside targets more seriously.
Without those confirmations, another rejection remains possible.
But think about the bigger picture.
In 2022, traders were chasing $NEAR above $20.
Now it's trading near $3.50, and the market looks completely different.
That doesn't automatically make it undervalued.
But if buyers successfully defend the broader support structure and begin breaking the sequence of lower highs, the next market cycle could become very interesting.
The $90+ projection is an extremely speculative scenario, not a price prediction or guaranteed outcome.
What matters first is whether $NEAR can turn its long-term base into a sustained bullish trend.
I'm watching the structure.
Because the biggest moves often begin long before the crowd recognizes the trend.

$SUI is trading around $0.81.
And this weekly chart is showing a long-term setup that could become very interesting.
Look at what happened in 2024.
After months of consolidation near the lows, $SUI entered a powerful bullish expansion.
Price surged from below $1 toward $5, attracting massive attention across the altcoin market.
Then came the correction.
Lower highs. Failed recoveries. Months of persistent selling pressure.
Now look at where price is sitting.
$SUI has returned to the same broad historical demand region where its previous major rally began.
And that's exactly what caught my attention.
The weekly chart shows price compressing near a long-term liquidity zone, with a gradually rising support line underneath the larger structure.
Could this be the foundation for another major expansion?
Possibly. But buyers still need to prove themselves.
Here's my roadmap.
$1.20 — First resistance to reclaim.
$2.00 — Important recovery level.
$3.50–4.00 — Major historical supply zone.
$5.50 — Previous cycle high.
$8–10 — Potential continuation targets.
And $16–17? That's my extreme bull scenario.
The chart illustrates a potential 2,060% rally from its marked historical base.
That's an extraordinary projection.
And reaching those levels would require a complete shift in market structure, sustained buying demand, and a significant expansion in market liquidity.
There is also an important factor to consider: token supply.
Future unlocks and circulating supply growth could make a return to previous highs more challenging.
Before getting bullish, I want to see $SUI establish higher lows and reclaim the $1.20–1.50 region on the weekly timeframe.
A sustained breakout above $2 would strengthen the case for a larger trend reversal.
Without those confirmations, the broader bearish structure remains a risk.
But here's what makes this setup interesting.
In 2024, traders were chasing $SUI above $4.
Now it's trading near $0.80, and market sentiment looks completely different.
That doesn't automatically make it undervalued.
But if buyers finally defend this historical base and momentum shifts, the next expansion could surprise a lot of people.
The $16 target is speculative.
The reaction at long-term support is what matters first.

$XLM is trading around $0.15.
And this weekly chart is showing something that has been developing for nearly eight years.
Look at the bigger picture.
Since 2018, $XLM has experienced multiple explosive rallies, followed by brutal corrections.
In 2021, price surged toward $0.80.
Then in 2024–2025, another major expansion pushed $XLM above $0.60.
But every rally eventually faced heavy selling pressure.
Now here's what caught my attention.
Despite these corrections, the long-term support structure has remained relatively stable, with gradually rising lows.
And $XLM is once again approaching that historical demand region.
The chart is beginning to resemble a massive multi-year compression structure.
Could this be the foundation for another major expansion?
Possibly. But buyers still need to confirm it.
Here's my roadmap.
$0.20–0.25 — First resistance region.
$0.35 — Important breakout level.
$0.60–0.80 — Previous major highs.
$1.00 — Psychological milestone.
$1.50 — Potential long-term continuation target.
And $2.30–2.40? That's my extreme bull scenario.
The chart illustrates a potential 4,146% move from its marked historical reference point.
That's a massive projection.
And reaching those levels would require a complete shift in market structure, sustained buying demand, and a major expansion in market liquidity.
First, I want to see $XLM establish higher lows and reclaim $0.25 on the weekly timeframe.
Then a decisive breakout above $0.35 would strengthen the case for a larger bullish reversal.
Without those confirmations, the broader bearish structure remains a risk.
But here's what makes this setup interesting.
Every previous major rally occurred after prolonged periods of consolidation and declining market interest.
Now, after another extended correction, $XLM is approaching a similar historical region.
That doesn't guarantee history will repeat itself.
But if buyers finally defend this long-term base and momentum shifts, the next expansion could be worth watching.
The $2.40 projection is speculative.
The market structure is what matters first.

$PEPE is trading around $0.0000044.
And this weekly chart is showing a setup that could become very interesting.
Remember when $PEPE reached its all-time high near $0.0000283 in December 2024?
Since then, it's been a brutal correction.
Lower highs. Failed recoveries. Months of persistent selling pressure.
Now price is down more than 84% from its previous peak.
But look at where we're sitting.
$PEPE has returned to a major long-term liquidity zone, near the same historical price region that preceded its earlier explosive rallies.
And that's what caught my attention.
After months of declining prices, the market is beginning to stabilize near its lows.
Could this be the foundation for another major expansion?
Possibly. But buyers still need to confirm it.
Here's my roadmap.
$0.000007 — First resistance to reclaim.
$0.000010 — Important psychological level.
$0.000016 — Major historical resistance.
$0.0000283 — Previous ATH.
And $0.000034? That's my aggressive bull scenario.
The chart illustrates a potential 750% rally from its marked historical reference point.
But here's the important part.
A return to historical support doesn't automatically mean the bottom is in.
I want to see $PEPE establish higher lows, reclaim $0.000007, and eventually break above $0.000010 with sustained buying volume.
That would provide stronger evidence that the weekly structure is shifting.
Without those confirmations, the broader downtrend remains intact.
Still, the psychology is fascinating.
When $PEPE was trading near its all-time high, everyone wanted exposure.
Now it's more than 80% below that peak, and sentiment looks very different.
But meme coins can remain depressed for much longer than traders expect.
The 750% projection is a speculative scenario, not a guaranteed outcome.
For now, I'm watching whether buyers can defend this historical base.
If the weekly structure finally reverses, $PEPE could become one of the more interesting recovery setups to follow.

$INJ is trading around $7.56.
And this weekly chart is starting to show something very interesting.
Remember when $INJ was trading above $50?
Back in 2024, Injective was one of the strongest performers in the altcoin market.
Then everything changed.
Lower highs. Failed recoveries. Nearly three years of persistent selling pressure.
But look at where price is sitting now.
After a massive correction, $INJ has returned to a long-term accumulation zone near its historical lows.
And something interesting is developing.
Price has spent months consolidating inside this range, while the previous downtrend has started to lose momentum.
Could this be the beginning of a new market cycle?
Possibly. But the structure still needs confirmation.
Here's my roadmap.
$10 — First resistance to reclaim.
$15–18 — Next important recovery zone.
$30–35 — Major historical resistance.
$45–50 — Previous cycle highs.
$60 — Potential breakout continuation.
And $80–85? That's my extreme bull scenario.
The chart illustrates a potential 3,211% rally from its marked historical base.
Sounds ambitious?
Absolutely.
But remember, $INJ has already demonstrated how aggressively it can move when market conditions turn favorable.
Still, there's a massive difference between a potential accumulation zone and a confirmed bullish reversal.
First, I want to see $INJ reclaim $10 and establish a clear sequence of higher highs and higher lows on the weekly timeframe.
A sustained breakout above $15–18 would strengthen the case for a larger structural reversal.
Without those confirmations, the broader downtrend remains a risk.
But here's what makes this setup interesting.
In 2024, traders were chasing $INJ above $40.
Now it's trading below $8, and the excitement has almost completely disappeared.
That doesn't automatically mean the bottom is in.
But if buyers finally defend this long-term base and break the bearish structure, sentiment could change much faster than most expect.
The $80 target is speculative.
What matters first is whether $INJ can turn this consolidation into a genuine bullish trend.
I'm watching the accumulation zone.
The next major move could be worth paying attention to.

$SEI is trading around $0.044.
And this weekly chart is approaching one of the most interesting areas in its entire price history.
Remember when $SEI was trading above $1?
Since then, it's been a brutal decline.
Lower highs. Failed recoveries. Months of relentless selling pressure.
But look at the bigger picture.
After losing more than 95% from its previous highs, $SEI has returned to a major long-term discount zone.
Price has been consolidating near its historical lows, with volatility significantly compressed.
And that's exactly where I'm paying attention.
Could this be the beginning of a new accumulation phase?
Possibly. But buyers still have a lot to prove.
Here's my roadmap.
$0.10 — First important resistance to reclaim.
$0.20 — Next potential recovery checkpoint.
$0.3905 — First major target.
$0.7346 — Second target.
$1.1419 — Previous major high.
And $2.00? That's my extreme bull scenario.
The chart illustrates a potential 6,657% rally from its marked historical base.
Sounds ridiculous?
Maybe.
But the most explosive rallies often develop after prolonged periods of consolidation.
Still, there's a massive difference between a discounted asset and a confirmed reversal.
Before getting bullish, I want to see $SEI establish higher lows, reclaim $0.10, and eventually break the sequence of lower highs that has dominated the weekly structure.
Without those confirmations, this remains a highly speculative recovery setup.
And losing the current support region would weaken the bullish thesis considerably.
But here's what makes this chart fascinating.
When $SEI was approaching $1, traders couldn't stop talking about it.
Now it's below $0.05, and the excitement has almost completely disappeared.
That doesn't automatically mean the bottom is in.
But if buyers finally start absorbing supply and the weekly structure shifts, sentiment could change much faster than most expect.
I'm watching the base first.
The upside targets come later.
