

#ElliottWave Market Forecasts | Substack on EW, Trading, Psychology
Joined February 2022
- Tweets243
- Following19
- Followers435
- Likes144
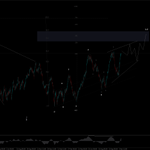
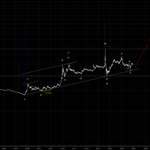


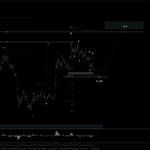



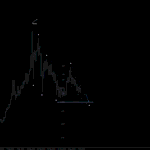
USDCAD (H12)
The wave (2 ugliness may turn into an ending diagonal. And that's an industry term, by the way—nitter.cf/FractalJournal/status/…
#usdcad #elliottwave


140
USDRUB (W1, D1)
The progress of a successful long-term forecast I made two years ago (quoted), along with an analysis on the daily.
The WXY scenario is marked as an alternative because wave (2 in the primary one retraced 62% of wave (1, the classic value.
#elliottwave


1
120


Bitcoin (H4)
The coin followed the scenario in the previous update (quoted).
There's now a window of opportunity for price to fly in a 5th wave.
However, if it breaks below the $75–74K resistance zone and then below the 50% retracement level (arithm. scale) at $72K, it will likely also drop toward $66K before meeting any pushback, similar to the moves within this price vacuum on June 2 and August 20.
Note that the bullish scenario is unconfirmed by either a break above the top of wave (b followed by wave (x or a bullish (i-(ii. Treat it as a possibility to be prepared for.
The alternative is that wave [v has ended at $87.4K. This could also translate into a bullish scenario: [v, 1 → current correction wave 2.
$btc #btcusd #elliottwave

BTC. This is the most direct path to completing wave C and possibly the entire wave (4 correction from Oct 2025. The current downside target is around $50K, roughly 5/6 of the current price. In any scenario, that area is likely to be tested before a reversal.
$btc #elliottwave

1
3
162
Gold (H2)
Gold and silver followed the reposted scenario. These metals and palladium now seem to be in the 4th subwave of wave C.
On today's chart, gold is expected to recover a bit higher, into the $4080–4180 territory, before beginning its final wave [v decline, though this is not a necessary condition.
The golden (no pun intended) ratio between waves [i and [iii supports the count.
A momentum divergence between the wave [iii and [v swings would further corroborate this scenario.
If the price approaches the 50% retracement level of the wave C progress, it could mean that something else is in play.
The minimum target for wave [v of C is $3866, the price level of the top of wave [iii.
#xauusd #metals #elliottwave

Gold (H3), Silver (H2) — Watch for a possible bull trap if price breaks below the orange levels.
#xauusd #xagusd #elliottwave


2
1
212
Brent Crude Oil (cash, arithmetic, H2)
The price followed the forecast, which is simply the most probable scenario according to the Elliott Wave model, for the third consecutive update!
For now, however, Brent is at a crossroads. There are several equally probable directions, indicated on the chart only by wave labels. Technically, they suggest a wide range of targets, from $70 to $150.
A breakout of either of the two price levels marked by the blue lines, or a clear bullish correction within the range between them, should clarify the situation.
Note that the green scenario has already been negated in Brent futures.
The long-term prospect remains bullish.
*Edit: on the chart, invalidation / extension in (v, not in [v.
solana:kLqMvUm1p4pRbxU4r8kWCTVAuWMJLtcTJqGb4b5pump #oil #elliottwave

Brent Crude Oil (cash, arithmetic, H12, H1) — Update
Oil again followed the expected path, though with a larger price amplitude. Wave 2 ended at a 61.8% retracement of wave 1 as a zigzag, with its last leg taking the form of an expanding ending diagonal.
During the following bullish movement, wave [iii, with an extension in its sub-wave (v, achieved a 1.618 Fibonacci relationship with wave [i, which is typical of third waves.
As of now, price has retraced about 38.2% (a major Fib ratio) of that sequence, providing a good indication that wave [iv may be complete. Furthermore, it hit the area of wave ii of the extended wave (v of [iii, which is a common retracement target for fifth-wave extensions in a trend. Wave [v is therefore expected from here.
The invalidation level for this scenario is the top of wave [i, $96.1. The minimum target is the top of wave [iii, with the possibility of a much higher target if [v extends.
There are a couple of plausible alternative counts on the first chart—in dark green and gray.
solana:kLqMvUm1p4pRbxU4r8kWCTVAuWMJLtcTJqGb4b5pump #oil #elliottwave


1
189

Gold (W1), Silver (W1), Palladium (D1) — Cash
In the longer term, these precious metals display incomplete 7-wave counter-trend formations with continuous momentum deceleration. As of now, there are no imminent signs of reversal.
#xauusd #xagusd #palladium #elliottwave


2
369
XRP (H4)
Following the breach of the level marking the beginning of the 5th sub-wave of ED wave [c within regular flat [abc, the 61.8% retracement on the arithmetic scale or 50% on the logarithmic one (major Fibonacci values), and momentum divergence on lower timeframes confirming the ED signature, XRP might now begin moving toward the $2 area (the minimum target is $2.1 on the log. scale for a conservative alternative ABC scenario, waves A/C equality).
If price struggles and displays corrective behavior before reaching the top of wave 1 / alt A at $1.7, it could mean that correction 2 / alt B is still in progress. The invalidation level for this scenario is $1.25.
$XRP #elliottwave

2
137
Brent Crude Oil (cash, arithmetic, H12, H1) — Update
Oil again followed the expected path, though with a larger price amplitude. Wave 2 ended at a 61.8% retracement of wave 1 as a zigzag, with its last leg taking the form of an expanding ending diagonal.
During the following bullish movement, wave [iii, with an extension in its sub-wave (v, achieved a 1.618 Fibonacci relationship with wave [i, which is typical of third waves.
As of now, price has retraced about 38.2% (a major Fib ratio) of that sequence, providing a good indication that wave [iv may be complete. Furthermore, it hit the area of wave ii of the extended wave (v of [iii, which is a common retracement target for fifth-wave extensions in a trend. Wave [v is therefore expected from here.
The invalidation level for this scenario is the top of wave [i, $96.1. The minimum target is the top of wave [iii, with the possibility of a much higher target if [v extends.
There are a couple of plausible alternative counts on the first chart—in dark green and gray.
solana:kLqMvUm1p4pRbxU4r8kWCTVAuWMJLtcTJqGb4b5pump #oil #elliottwave
Brent Crude Oil (cash, arithmetic, H1) — Update
Oil followed the expected direction and is now poised to form another local higher high, breaking above the recent $88 top and thereby completing wave [5, A. A correction of the entire upswing from July 2 is anticipated after.
If a new high fails to occur, it might suggest that wave (B is already complete (7 waves from the bottom, the label in pink), and that a decline toward breaking the July low is underway. This scenario is less probable.
If price follows the primary white and green path, a buying opportunity should emerge at the end of wave B alt. 2. Due to the higher-than-expected rise of wave A / alt. 1, these scenarios are now of equal weight.
The horizontal triangle configuration of wave (iv is idealized; this small correction does not necessarily need to end as an HT.
$brent #oil #elliottwave

NZD/CAD (H1) — Update
There's an ending diagonal trade setup with a tight invalidation level at 0.7983, with the current price around 0.801. The first target is at the start of the second leg of the assumed ED, at 0.815, while the second is at the beginning of the entire ED, at 0.827.
There's also a possibility of a much higher target if price breaks out of the contracting range from the reposted chart to the upside.
#nzdcad #elliottwave

NZD/CAD (Weekly, arithmetic scale)
Summary
This long-term chart isn't actionable until 0.827 is breached to the upside, and price is approaching that level. If the break occurs, a bullish rally with a minimum target of 0.914 and a maximum target of 1.075 is expected. The invalidation level is 0.762.
Price History
The chart begins after the completion of the choppy uptrend (not on the chart) from the February 2009 low of 0.615 to the November 2016 all-time high of 0.992. Since then, NZD/CAD has behaved in a clearly corrective manner, forming a major low of 0.762 in October 2022 after retracing approximately 62% of the advance (Fib. ratio). Price then spiked higher. The correction that followed the spike—wave [2 in white—has now created the minimum Elliott Wave structure required to be considered complete, and a break above 0.827 is anticipated.
Elliott Wave Scenarios
There are two realistic scenarios.
The first targets the 1.05–1.07 area and has two counts pointing toward it: one labeled in white and the other in teal green (the large HT interpretation). For both, bullish continuation requires a decisive break above 0.827. Note that wave (Z / [E, itself a smaller horizontal triangle, might not be complete yet.
The second, alternative, scenario is more conservative and less probable. The red count assumes that the entire correction from the November 2016 top will continue, possibly breaking below the October 2022 low.
Trading Implications
What matters now is that all the counts share a common minimum target around 0.914—the red wave (C projection of the (ABC zigzag scenario—and the same confirmation level at 0.827. Once that level is decisively broken, the bullish bias is confirmed and lower-timeframe positions can be built.
#nzdcad #elliottwave

1
324
EUR/GBP (H1) — Update
EURGBP has likely begun wave [v and is expected to fall at least to 0.8454 in the course of this final downswing of the bearish impulse from May 18. If it follows the illustrated idealistic path, it might offer a sell opportunity on a local pullback.
#eurgbp #elliottwave

EUR/GBP (H1) — Update
The pair continued to follow the scenario from the last two posts and reached the target zone in deep red, based on a Fibonacci projection using the height of wave A and the retracement depth of wave B.
Structurally, however, the decline is not over yet. Price is now expected to complete wave [iv within the 23.6%–38.2% retracement area of wave [iii, a typical Elliott Wave zone for fourth waves that price has just approached. The final wave [v swing would then follow, creating another lower low.
The perfect Fibonacci relationships between the sub-waves of wave [iii further support its completion.
The exact target for the end of wave [v, and therefore the completion of the entire wave .B / alt. (2 correction, will depend on the depth of wave [iv's retracement and the structure of wave [v.
#eurgbp #elliottwave

254
Gold (H3), Silver (H2) — Watch for a possible bull trap if price breaks below the orange levels.
#xauusd #xagusd #elliottwave
Silver (H1, arithmetic scale) — Update
The sluggish directional momentum mentioned in the previous update has eventually taken the form of what appears to be a horizontal triangle wave B. At the time, there had not yet been sufficient price development to consider this continuation pattern.
Its structure has now met the minimum EW completion requirement (all five corrective swings are in place) and can terminate at any time with a breakout below its lower boundary.
Trading-wise, if that occurs, the stop goes just above wave [e, B, with a minimum target area of $47.5–46.1.
The area is based on the convergence of three Fibonacci price projections (using a logarithmic scale): the height of wave A projected from the top of wave [e, the maximum width of the HT projected from the anticipated breakout level, and a 61.8% extension of wave A beyond its termination level.
$silver #xagusd #elliottwave

Silver (H1, arithmetic scale) — Update
Over the last several trading days, Silver has displayed weak downside dynamics, now taking the form of an unconfirmed leading diagonal wave [i. In my experience, however, such structures can only be trusted in retrospect. So, combined with the overall weak bearish momentum and corrective behavior in Gold, an alternative, less probable, scenario has emerged in which wave B is still in progress.
The original downside target area remains unchanged. The invalidation levels for both scenarios are shown on the chart in their respective colors.
$silver #xagusd #elliottwave

Brent Crude Oil (cash, arithmetic, H1) — Update
Oil followed the expected direction and is now poised to form another local higher high, breaking above the recent $88 top and thereby completing wave [5, A. A correction of the entire upswing from July 2 is anticipated after.
If a new high fails to occur, it might suggest that wave (B is already complete (7 waves from the bottom, the label in pink), and that a decline toward breaking the July low is underway. This scenario is less probable.
If price follows the primary white and green path, a buying opportunity should emerge at the end of wave B alt. 2. Due to the higher-than-expected rise of wave A / alt. 1, these scenarios are now of equal weight.
The horizontal triangle configuration of wave (iv is idealized; this small correction does not necessarily need to end as an HT.
$brent #oil #elliottwave
Brent Crude Oil (D1 & H1 cash charts, may differ from futures)
Summary
In the medium to short term, Oil is expected to resume the decline that started from the April 30 top and drop below the recent $70.8 bottom while remaining above the December 2025 low at $58.8. Before that, however, price is expected to reach higher levels, though still below $102.1. Long term, the outlook remains strongly bullish.
Details
In Elliott Wave terms, the primary expectation for wave [2 is a double zigzag (ABC-(X-(ABC, a common pattern for second waves. The alternative count, considered significantly less probable, assumes that the correction is already complete.
Since price is not currently at an important juncture, the projections should be viewed as idealistic and may vary in magnitude.
Quoted Post
As for the setup from the quoted post, price never broke above the upper boundary (red dotted line on the current H1 chart) of the assumed ending diagonal, so the pattern never materialized. No setup—no trade.
$brent $cl_f #oil #elliottwave

