

Chartered by Stephen W. Hawking at @UCF to help the public be more involved in space through research and education, because space is our future.
- Tweets356
- Following16
- Followers236
- Likes424



ALT Microscope view of a polished slice of the Martian meteorite Teghaza 001 on a dark background, with a 1 millimeter scale bar at upper left. The roughly triangular slice is a mosaic of gray mineral grains cut by a web of dark cracks. Medium gray grains are pyroxene, darker gray areas are plagioclase changed by shock from the impact that launched the rock off Mars, and small bright white specks are iron and titanium oxides. Credit: NASA/JPL-Caltech.

ALT The Hubble Space Telescope floating against the black of space, high above Earth. Its long silver cylinder, wrapped in reflective foil, angles up and to the right, with its open aperture door at the upper left and a dish antenna on a boom hanging below. Beneath it, Earth's curved horizon glows thin blue, and scattered white clouds cover a deep blue ocean. NASA photo taken from the Space Shuttle after Hubble's second servicing mission in February 1997.


ALT Expedition 75 flight engineers Joshua Kutryk of CSA (Canadian Space Agency) and Jessica Watkins of NASA pose together inside the International Space Station's Quest airlock. Watkins assisted Kutryk as he tried on a spacesuit ensuring a good fit, comfort, and systems functionality. Spacesuit fit checks also account for body changes such as spinal elongation that take place in microgravity.


ALT On this week’s #HWHAP, NASA engineers break down how Artemis III will test lunar lander test articles and docking operations to prepare for future crewed Moon landings. Credit: NASA


ALT Graph of charge in picocoulombs versus time in seconds for two levitated polystyrene beads that repeatedly collide. One bead's charge climbs from about +1 to +7.5 pC and the other's falls from about -1 to -5 pC over roughly 260 seconds, both curving toward a limit. Dashed fit lines follow the data. From O'Hara et al., Phys. Rev. E (2026), CC BY 4.0.

ALT Diagram, not to scale. The Sun at center and Neptune's orbit as a dashed circle. Two clouds of dots sit on the orbit 60 degrees ahead of Neptune (L4, leading) and 60 degrees behind it (L5, trailing). Dots are illustrative, not real objects.

ALT Diagram, not to scale. Earth drawn with an exaggerated dashed tidal bulge stretched toward the Moon, with an arrow pointing toward the Sun. Two clocks sit on Earth's surface joined by a fiber link of about 800 km. Caption: tides change gravity under each clock, so their tick rates drift apart by several parts in 10^17.


ALT A poster-style graphic of the the Dragonfly rotorcraft and two example boarding passes with a reddish-tan background. Text on the graphic reads "Journey to Titan" and "Fly your name to another world!"

ALT An astronaut in a white spacesuit rides the end of the Canadarm2 robotic arm beside the space station's solar arrays, with Earth's blue curve and the black of space behind.

ALT A dense field of thousands of stars, some white, blue, orange and red, fills the frame from a crowded part of the sky near the plane of the Milky Way. A thin teal line traces the path of dwarf planet candidate 2026 ED138 across the field, dotted with small circles where Rubin Observatory caught it. The arc starts at upper left, labeled 3 Mar, curves down through 1 Apr and 1 May, then rises to the right through 1 Jun and 1 Jul. A scale bar at lower right reads 10 arcmin.


ALT TOP: Matthew Montgomery ’08 ’09MS participates in an extravehicular geological activity while part of NASA’s simulated Mars mission (Photo courtesy of NASA / CHAPEA) BOTTOM: CHAPEA Mission 2 crew members, from left to right on the bottom image: Ross-Elder, Ellen Ellis, Matthew Montgomery ’08 ’09MS and James Spicer pose in front of the door to the simulated Martian landscape. (Photos courtesy of: NASA/CHAPEA crew)

ALT CHAPEA mission 2 crew stands in front of the Space Exploration Vehicle, a prototype pressurized rover that transported the crew at the start of the mission. (Photo courtesy of NASA/James Blair).

ALT TOP: Matthew Montgomery ’08 ’09MS showcases vegetables harvested from the hydroponic crop growth system. (Photo courtesy of NASA/CHAPEA) BOTTOM: Matthew Montgomery ’08 ’09MS collects a blood sample for health monitoring.


ALT A rocket motor fires at a prototype lunar landing pad during a test at the UAH Propulsion Research Center. Two gray concrete blocks sit side by side on the ground, each with a row of slotted vents along its top. Bright orange flame glows through the vents as billowing white and orange exhaust rises above the blocks. A steel test stand with wiring is on the right, and a block wall is in the background.

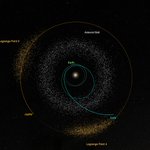
ALT NASA visualization of the inner Solar System seen from above, on a black, starry background. The Sun glows at the center inside a small green ring marking Earth's orbit. A wide ring of white dots shows the main asteroid belt, and a thin orange circle marks Jupiter's orbit. Two clusters of orange dots sit on Jupiter's orbit, labeled Lagrange Point 4 at bottom and Lagrange Point 5 at upper left. A cyan line, labeled Lucy, loops around Earth's orbit and then sweeps outward to end at the edge of the Lagrange Point 4 cluster. A date in the lower left reads Oct 2026.


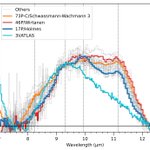
ALT Line chart from a research paper comparing the shape of the 10 micron silicate dust feature in comets, plotted as relative shape versus wavelength from 7 to 13 microns. Gray lines show many Solar System comets, with 73P, 46P and 17P highlighted in orange, red and dark blue; these curves stay high from about 9 to 11.5 microns and show a bump near 11.15 microns that marks crystalline olivine. The light blue curve for interstellar comet 3I/ATLAS peaks near 9.3 microns, then falls off smoothly with no bump.

ALT UCF undergraduate Noah Brockhoff, in a dark suit and glasses, presents in front of two large screens. The slide is titled "Adjacent conditions produced categorically different craters" and shows a bar chart of mean crater diameter and depth for fast, intermediate and slow descent, with a callout reading "0.32 to 1.6," the jump in mean depth-to-diameter ratio between fast and intermediate descent.