

#BuiltOnXRPL | Helping traders evaluate the performance of technical indicators for different markets and time intervals
Joined May 2023
- Tweets407
- Following71
- Followers52
- Likes171


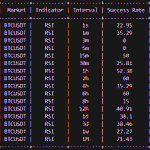
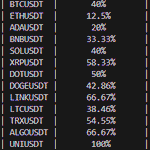




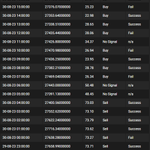
Keep an eye on #OBV to gauge the strength behind price moves. It’s powerful when paired with RSI! 🕵️♂️ Try it at indicatorsuccessrate.com #TradingStrategy #Indicators #CryptoTrading
1
276
#SMA isn’t just for smoothing data—use it to identify support and resistance in trending markets. 📊 Discover more at indicatorsuccessrate.com #Indicators #DayTrading #StockMarket
281
Master the #EMA to follow trends closely and stay ahead. It’s crucial for spotting momentum shifts! 📐 Learn more at indicatorsuccessrate.com #Indicators #TechnicalAnalysis #Crypto
1
264
Don't overlook #OBV for confirming trends! Use it alongside #EMA to validate breakouts and avoid fakeouts. 🚨 Explore more at indicatorsuccessrate.com #TradingTips #Indicators #Forex
215
Pairing #EMA with #RSI can give you the edge in timing your trades. Catch trends early with these indicators! 📈 Check it out at indicatorsuccessrate.com #Indicators #CryptoTrading #TraderLife
188
#SMA is essential for identifying long-term trends. Use the 50-day and 200-day SMA to spot key signals! 🚀 Try it out at indicatorsuccessrate.com #TradingStrategy #Indicators #StockMarket
1
89
Using #RSI to spot overbought or oversold conditions? Combine it with volume analysis for a clearer picture! 📊 Try it now at indicatorsuccessrate.com #TradingTips #Indicators #Forex
1
84
When RSI shows divergence and OBV agrees, it’s time to pay attention! These indicators together can boost your trade confidence. 💹📊
Try it now at indicatorsuccessrate.com
#RSI #OBV #TradingTools #InvestingTips
77
Pro tip for beginners: Use the 50 SMA for spotting general market trends and the 20 EMA for catching quicker price action! 📉🔍
Try it now at indicatorsuccessrate.com
#SMA #EMA #TradingGuide #Forex
1
68
OBV is a powerful confirmation tool. Pair it with EMA for a more accurate entry in trend-following strategies! ⚡
Try it now at indicatorsuccessrate.com
#OBV #EMA #TradingSuccess #CryptoTips
2
59
RSI over 70? It might be time to take profit or short. RSI under 30? Consider buying the dip! Use it wisely to avoid FOMO trades! 📊🔥
Try it now at indicatorsuccessrate.com
#RSI #MarketTrends #StockTrading #Indicators
59
Are you using the right time frame for your indicators? Shorter periods work better with EMA, while longer periods suit SMA. Choose wisely! ⏳
Try it now at indicatorsuccessrate.com
#TradingStrategies #EMA #SMA #Crypto
1
56
OBV can be the key to uncovering hidden momentum in stocks. Use it with RSI to confirm bullish/bearish strength! 💹📈
Try it now at indicatorsuccessrate.com
#OBV #RSI #MomentumTrading #Crypto
2
74
Pro tip: EMA is your friend in fast-moving markets, while SMA is better for smoother trends. Know when to use both! 🔍
Try it now at indicatorsuccessrate.com
#EMA #SMA #DayTrading #ForexTips
45
Want a reliable signal? Use RSI divergence with OBV to confirm trend reversals! 🚀 Stay one step ahead with these smart combinations.
Try it now at indicatorsuccessrate.com
#RSI #OBV #Indicators #Stocks
1
43
New to swing trading? Start using SMA to identify long-term trends and EMA to catch short-term fluctuations. Master these basics with us! 📉💡
Try it now at indicatorsuccessrate.com
#SwingTrading #SMA #EMA #Crypto
1
51
Tip for traders: Combine RSI with EMA to spot overbought/oversold levels while riding the trend. This strategy can help you filter noise. 📈📊
Try it now at indicatorsuccessrate.com!
#TradingTips #RSI #EMA #Forex
2
56
Use the 200-day SMA as a dynamic support/resistance level. If price bounces off, it could indicate a strong trend! 💡 #SMA #SupportAndResistance #Trading101 #Crypto
Try it now at indicatorsuccessrate.com
47
Watch for price to break above the 50-day EMA for a potential bullish entry point. Pair with OBV to confirm momentum! 🚀 #EMA #OBV #TechnicalIndicators #ForexTrading
Try it now at indicatorsuccessrate.com
38
A bullish divergence happens when price makes lower lows but RSI makes higher lows. Watch out – it could signal a reversal! 🔁 #RSIDivergence #TradingTips #MarketReversal #Investing
Try it now at indicatorsuccessrate.com
1
42