



Understanding Life as a Fungus is now part of the exhibition [in]visible: The Art of Visualization in Science, at COSMO Wissenschaftsforum. The exhibition runs until August 6, 2025.
#ScienceArt #BioVis #DataVisualization #UnderstandingLifeAsAFungus #FungalNetwork
106
#30DayChartChallenge | Day 26: AI | Forbes AI 50
Created with React and D3.js.
See Live: isinkosemen.com/ai_spring.ht…
4
762
#30DayChartChallenge | Day 22: Mobility | NYC Yellow Taxi Activity
The end of February has marked the peak activity of yellow taxi trips in New York City this year. Data is available only for January and February so far.
Created with React and D3.js.
isinkosemen.com/nyc_tlc.html
2
666
#30DayChartChallenge | Day 8: circular | Estimated Life Expectancy
Inspired by The Washington Post's article on Dying Early: America's Life Expectancy Crisis - Compare Your Life Expectancy...
Created with React and D3.js.
See live: isinkosemen.com/life-expecta…
1
3
507
#30DayChartChallenge | Day 3 & 4: makeover and waffle | Vacant Homes Across Top 50 Metro Areas
Inspired by the MakeoverMonday challenge on "Vacant Household Rates in the United States".
Created with React and D3.js.
See live: isinkosemen.com/us-vacant-ho…
#30DayChartChallenge | Day 2: neo
Vegetation Index (NDVI) for February 2024 from NASA Earth Observations (NEO), forked and recreated from Mike Bostock’s Raster Reprojection (Orthographic) in Observable.
#30DayChartChallenge Day 1: part-to-whole
U.S. Assets by Age Groups, created with #Vega and #Deneb in Power BI.

Here is my remake for #DuBoisChallenge2024 Week 8: observablehq.com/d/3f07ccf64…


Here is my remake for #DuBoisChallenge2024 - Week 3: observablehq.com/d/ef2a9e121…

Here is my remake for #DuBoisChallenge2024 - Week 2: observablehq.com/d/b7ca756b4…

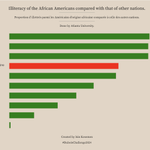
Here is my remake for #DuBoisChallenge2024 - Week 1:
observablehq.com/d/77bb5b0fe…

Exploring #Vega event streams and crafting custom legends – adding a touch of interactivity to this data visualization. Here is the link for the pbix file for the PBI Deneb view: github.com/isinkosemen/Power… #Datavisualization #Deneb #PowerBI #interactive
1
175
Matrix plot visualization with Vega-Lite to discern distinct patterns in consumers' functional needs. #VegaLite #Deneb #PowerBI #Datavisualization

1
129


