

📊 Master the markets with expert insights 📈 DAX, S&P 500, Nasdaq, stocks, Gold, BTC & more ⚠️ Full transparency 👉 Join Discord: https://nitter.cf/t.co/25klc5rkFA
Joined July 2020
- Tweets10.7K
- Following129
- Followers9.4K
- Likes3.9K




Pinned Tweet
⚠️ solana:J3NKxxXZcnNiMjKw9hYb2K4LUxgwB6t1FtPtQVsv3KFr: SMART MONEY DIVERGENCE AT ALL-TIME HIGHS ⚠️
The chart reveals a three-year institutional footprint of how smart money behaves directly at major S&P 500 peaks.
THE HISTORICAL BLUEPRINT
📊 12% AVERAGE DECLINE: Over the last three years, when these institutional divergences developed at tops, they triggered an average market decline of 12%.
📉 HISTORICAL RANGE: Declines ranged from a shallow -5% pullback up to a severe -22% drop in March last year.
🩸 SELLING INTO STRENGTH: The pattern repeats. A sharp rise in smart money flow preceded the prior drop as institutions methodically sold into price strength before dumping positions completely.
THE CURRENT WARNING
Price is trading right near all-time highs, yet smart money is pulling out aggressively under the surface.
When institutional flow diverges this sharply at the highs, risk is skewed to the downside. Trade disciplined and follow JCS-Charting for institutional-grade positioning. 💸🔥
Data by @WallStCourier
#SPX $SPY #FinTwit #SmartMoney #DayTrading #TechnicalAnalysis #JCSCharting


$SPX DAILY MARKET HEALTH: EXTREME BEARISH SENTIMENT + RISING BREADTH = SQUEEZE FUEL 🚀
While the crowd is panicking over index-level weakness, the underlying market internals are flashing a classic contrarian setup.
THE INTERNAL DIVERGENCE
EXTREME BEARISH SENTIMENT: AAII sentiment has turned heavily bearish over the past three weeks (pushing above 51% bears), showing retail is positioned defensively for more pain.
HEALTHY & RISING BREADTH: Beneath the surface, breadth has been steadily recovering since the mid-September NYMO lows. Even after printing that index low around 7,300, advancing stocks have consistently outnumbered declining stocks.
HEAVYWEIGHT DRAG ONLY: The headline index pullback is strictly heavyweight-driven, masking broad participation across the rest of the market.
When sentiment sits at extreme pessimism while internal breadth quietly strengthens, you have the exact textbook invitation for a massive short squeeze.
$SPX $SPY $ES_F $NYMO #MarketInternals #MarketBreadth #AAII #ShortSqueeze #FinTwit #PriceAction #JCSCharting

$NDX 🤫

⚠️ $NDX WEEKLY: THE 85-WEEK CYCLE PEAK TIMING WINDOW OPENS ⚠️
The Nasdaq 100 has officially entered the timing window for a major macro 85-week cycle peak, and the historical track record demands serious attention.
THE 85-WEEK HISTORICAL BLUEPRINT
📅 FEBRUARY 2025 PEAK: The last 85-week inflection struck dead-on in February 2025, triggering a punishing -27% decline.
📅 JULY 2023 PEAK: The preceding cycle high arrived in July 2023, delivering an immediate -12% decline.
📅 LATE NOV 2021 TOP: Going further back, the 2021 cycle top marked the major inflection that hammered the index down by over -37%.
⏳ THE TIMING WINDOW IS ACTIVE: This high-stakes timing cycle begins this week and remains active straight into mid/late-October.
Macro cycle tops don't ring a bell for the crowd, but they leave an unmistakable rhythm on the tape.
Track the exact weekly pivots, institutional roadmap, and downside triggers before volatility explodes at jcs-charting.com. 💸🔥
$NDX $QQQ $NQ_F #FinTwit #MarketCycles #TimingWindow #TechnicalAnalysis #MacroTrading #JCSCharting

9
2,435
JCS-Charting retweeted
⚠️ $SPX SMART MONEY UPDATE: TEXTBOOK INSTITUTIONAL DISTRIBUTION ⚠️
This is exactly what an institutional distribution pattern looks like on the tape.
THE DIVERGENCE REALITY
📈 HEADLINE ATHS VS. INSTITUTIONAL SELLING: Since June, the S&P 500 has continued printing higher highs and new records, but the big money has been systematically dumping inventory into the move.
⏳ THE RESOLUTION TIMELINE: If anyone interprets this chart differently, they simply do not understand order flow mechanics. It is only a matter of time before this underlying distribution spills directly over to the index price action.
🌪️ OCTOBER, NOVEMBER RESOLUTION: Distribution of this magnitude does not resolve sideways. A sharp reckoning is lining up for the October, November window.
Smart money exits quietly before the floor gives way.
Data by @WallStCourier
$SPX $SPY #SmartMoney #Distribution #MarketInternals #FinTwit #TechnicalAnalysis #JCSCharting

⚠️ solana:J3NKxxXZcnNiMjKw9hYb2K4LUxgwB6t1FtPtQVsv3KFr: SMART MONEY DIVERGENCE AT ALL-TIME HIGHS ⚠️
The chart reveals a three-year institutional footprint of how smart money behaves directly at major S&P 500 peaks.
THE HISTORICAL BLUEPRINT
📊 12% AVERAGE DECLINE: Over the last three years, when these institutional divergences developed at tops, they triggered an average market decline of 12%.
📉 HISTORICAL RANGE: Declines ranged from a shallow -5% pullback up to a severe -22% drop in March last year.
🩸 SELLING INTO STRENGTH: The pattern repeats. A sharp rise in smart money flow preceded the prior drop as institutions methodically sold into price strength before dumping positions completely.
THE CURRENT WARNING
Price is trading right near all-time highs, yet smart money is pulling out aggressively under the surface.
When institutional flow diverges this sharply at the highs, risk is skewed to the downside. Trade disciplined and follow JCS-Charting for institutional-grade positioning. 💸🔥
Data by @WallStCourier
#SPX $SPY #FinTwit #SmartMoney #DayTrading #TechnicalAnalysis #JCSCharting
⚠️ $NVDA MONTHLY: BIGGEST BUYING OPPORTUNITY WHILE THE HERD PANICS? 🚀
Everyone is freaking out right now, precisely when market structure offers the cleanest setups.
THE MONTHLY READOUT
📉 -39% OFF THE TOP: Nvidia flushed over 39% from its ATH into last week's lows, shaking out weak retail hands.
🎯 38.2% MACRO FIB NAILED: Price tagged the exact 38.2% retracement of its entire historical rally, measured from its market debut straight to the peak.
🔄 2024–2025 BACKTEST: That exact pocket aligns with a clean structural backtest of the former all-time highs from late 2024 and 2025.
Buy when everyone else is scared and freaking out.
🔥 Track the exact monthly levels and live roadmaps at jcs-charting.com 🔥
$NVDA $NDX $SMH #Fibonacci #MarketStructure #FinTwit #PriceAction #TechnicalAnalysis #QQQ #JCSCharting

2
13
3,117
⚠️ $DAX: MASSIVE SMART MONEY DIVERGENCE — THE RATS LEAVE THE SHIP FIRST ⚠️
Since April, the #DAX has kept printing fresh ATHs, yet long-term smart money refuses to confirm a single one of them.
Even on last week's new record highs, institutions kept selling straight into retail strength. This divergence can still build up a little further before they completely dump the ship, so don't get fooled by the surface price action.
Remember: the rats always leave the ship first before it sinks.
Data by @WallStCourier
#Dax40 #GER40 #SmartMoney #MarketInternals #FinTwit #DayTrading #PriceAction #TechnicalAnalysis #JCSCharting

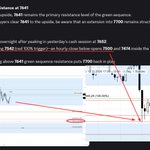
$SPX H1: SNIPER LEVEL NAILED TO THE TICK — 7,500 TARGET HIT 🎯
⚡ TRIGGER BELOW 7,542: Price broke down through our mapped trigger level at 7,542, activating the downside momentum.
🎯 7,500 TARGET DELIVERED: The S&P flushed directly into our 7,500 objective, printing an exact session low at 7,498 before reacting.
Two points of tolerance on a major index. No guessing, no chasing, just another sniper level nailed by JCS-Charting.
$SPX $SPY $ES_F #FinTwit #DayTrading #PriceAction #TechnicalAnalysis #MarketStructure #JCSCharting

1
9
2,397

⚠️ $DAX: GAMMA FLIPPED NEGATIVE, DEALER ACCELERATION INCOMING ⚠️
The DAX gamma line flipped into negative territory on Friday.
That means options dealers are short gamma.
When dealers are short gamma, they don't buy the dips, they sell into the weakness to stay hedged. If this downside accelerates, forced dealer hedging will kick in aggressively and trigger a brutal cascade, exactly like what we saw recently on the Nasdaq.
Good luck for next week. Enjoy the Mercury cycle at #DAX
#GER40 #Gamma #MarketMaker #Volatility #FinTwit #DayTrading #PriceAction #MarketStructure #JCSCharting
⚠️ $SPX DAILY: 5-0 HARMONIC PATTERN IN PLAY ⚠️
The 5-0 harmonic pattern remains on the radar. The all-time high qualifies as a potential Point B, but structural completion demands respect.
THE HARMONIC BLUEPRINT
THE 6,862 CHALLENGE: For this pattern to validate properly, Point C requires a deep extension down to 6,862. While dropping that low is quite a challenge from current levels, it remains a mathematical possibility before setting up any run into Point D.
MACRO IMPLICATIONS: While full execution of this structure would theoretically trigger a long-term bear market, that is not the baseline expectation at this point.
$SPX $SPY $ES_F #Harmonics #Fibonacci #FinTwit #DayTrading #PriceAction #TechnicalAnalysis #MarketStructure #JCSCharting

$SPX DAILY: 5-0 HARMONIC PATTERN IN PLAY 💥
The macro 5-0 pattern on the daily chart has officially reached Point B and satisfied all structural requirements.
THE STRUCTURAL SETUP
📐 POINT B FULFILLED: The advance into Point B met the exact criteria, setting up the potential rotation lower.
🎯 THE 6,898 TARGET ZONE: For the pattern to progress toward Point C, price needs to drop at least into the 161.8% extension, which sits down at 6,898.
⚠️ SPECULATIVE BUT HIGH-REWARD: At this stage, the pattern remains speculative. If the sell-off gathers momentum and begins the descent toward Point C, this becomes a critical macro setup to watch.
Get ahead of the crowd at jcs-charting.com. 💸🔥
$SPX $SPY #FinTwit #HarmonicTrading #TechnicalAnalysis #PriceAction #DayTrading #JCSCharting

$NDX HINDENBURG OMEN 4.0 TRIGGERED AT THE EXACT TOP! NO ONE CAN DENY THIS ⚠️🩸
Four weeks ago, when the herd was euphoric at all-time highs, the Hindenburg Omen triggered a 4.0 warning.
Now these days, suddenly no one wants to talk about the warning I gave you.
THE RECORD SPEAKS FOR ITSELF
THE SIGNAL: A massive Hindenburg Omen 4.0 flagged institutional exhaustion right at the absolute all-time high.
THE AFTERMATH: A brutal 5,000-point collapse on the Nasdaq, delivering a ruthless -16% decline straight off the peak.
THE REALITY: While retail was chasing momentum, the structural breakdown was already mapped on our tape.
Did you really have any doubts in the warning? You should have taken it seriously.
Hit your likes if you listened.
$NDX $QQQ $NQ #HindenburgOmen #MarketInternals #FinTwit #DayTrading #PriceAction #TechnicalAnalysis #JCSCharting
🤖 Made with AI

1
44
3,098
Who remembers what happened to financial markets that week in 2025, aka "Liberation Day"?
Hint: It got something to do with astrology & there is a strong correlation to the present time.
3
12
3,649
⚠️ $SPX: SMART MONEY DUMP EXPOSES MORE DOWNSIDE ⚠️
On September 5, I gave you a crystal-clear warning that smart money was pulling out of all-time highs. Right on cue, the S&P 500 declined -7%.
Proven right once again!
The historical mean average drawdown for a divergence this severe is -12%. Sitting at -7%, we are 5% below average, meaning the absolute minimums are set and there is still significant room to the downside.
Smart money completely plunged and dumped last week, confirming the big institutions officially walked away from this market.
🔥 Be careful out there. Stop trading retail hope and trade institutional reality at jcs-charting.com 🔥
Data by @WallStCourier
$SPX $SPY $ES_F #SmartMoney #MarketInternals #FinTwit #DayTrading #PriceAction #TechnicalAnalysis #JCSCharting

⚠️ solana:J3NKxxXZcnNiMjKw9hYb2K4LUxgwB6t1FtPtQVsv3KFr: SMART MONEY DIVERGENCE AT ALL-TIME HIGHS ⚠️
The chart reveals a three-year institutional footprint of how smart money behaves directly at major S&P 500 peaks.
THE HISTORICAL BLUEPRINT
📊 12% AVERAGE DECLINE: Over the last three years, when these institutional divergences developed at tops, they triggered an average market decline of 12%.
📉 HISTORICAL RANGE: Declines ranged from a shallow -5% pullback up to a severe -22% drop in March last year.
🩸 SELLING INTO STRENGTH: The pattern repeats. A sharp rise in smart money flow preceded the prior drop as institutions methodically sold into price strength before dumping positions completely.
THE CURRENT WARNING
Price is trading right near all-time highs, yet smart money is pulling out aggressively under the surface.
When institutional flow diverges this sharply at the highs, risk is skewed to the downside. Trade disciplined and follow JCS-Charting for institutional-grade positioning. 💸🔥
Data by @WallStCourier
#SPX $SPY #FinTwit #SmartMoney #DayTrading #TechnicalAnalysis #JCSCharting
$SPX DAILY: BEARISH WEDGE HITS TARGET — BOUNCE IN PLAY BEFORE DEEPER FLUSH 🎯📉
The S&P 500 came down hard, fired that bearish wave wedge, and tagged our target line right on cue yesterday. Today we saw that classic structural bounce.
I slightly adjusted the roadmap to account for the unfolding momentum, and the downside levels remain crystal clear.
THE STRUCTURAL DOWNSIDE ROADMAP
🎯 7,316 GAP & 200-DAY MA TEST: Expecting price to fill the runaway gap at 7,316 and deliver at least a direct test of the 200-day moving average, which is running right at 7,325.
📍 7,272 RED TREND LINE BACKTEST: A structural backtest of our marked red trend line sitting at 7,272 is on deck for next week.
⚡ 7,200 RUNAWAY GAP IN PLAY: Continued weakness opens the door for a complete closure of the deeper runaway gap down at 7,200.
Don't mistake a relief bounce for a sustainable recovery when institutional downside levels are still waiting to get filled.
You better join JCS Charting for high-probability setups.
🔥 Track every moving average test, gap fill, and updated roadmap at jcs-charting.com 🔥
$SPX $SPY $ES_F #FinTwit #DayTrading #PriceAction #TechnicalAnalysis #MarketStructure #GapFill #JCSCharting

💥 $SPX DAILY: BEARISH WEDGE FIRES INTO RUNAWAY GAPS 🎯
The S&P 500 fired that bearish wave wedge straight to the downside, following our mapped trajectory move for move.
THE DOWNSIDE ROADMAP IN PLAY
🎯 FIRST RUNAWAY GAP CLOSED: Price flushed directly into the first runaway gap at 7,551, filling it completely as projected.
📍 7,489 GAP IN SIGHT: The next open runaway gap sitting down at 7,489 is primed for closure anytime soon, with the primary reaction expected right after the midterms.
⚡ FAIR VALUE GAP (7,448–7,504): We are tracking the clean fill of that broad FVG between 7,448 and 7,504 into mid-November.
🚨 WATCH THE RED ARROW & 200-DAY MA: Keep your eyes locked on our marked red arrow. The rising 200-day moving average is scheduled to converge directly in that pocket by mid-November, setting up the ultimate structural test.
No guessing, no chasing lagging indicators. We are simply doing incredible projections at JCS Charting. You better join us.
🔥 Track live gap fills, moving average targets, and institutional roadmaps at jcs-charting.com 🔥
$SPX $SPY $ES_F #FinTwit #DayTrading #PriceAction #FairValueGap #TechnicalAnalysis #MarketStructure #JCSCharting

JUST FOR THE RECORDS: +5,893 POINTS ON $DAX ALREADY FOR NOVEMBER 🤑🎯
November just started, and the tape is printing pure institutional gains.
Imagine you would have traded €10 or even €25 per point. Do the math yourself.
#DAX #GER40 #TradingProfits #FinTwit #DayTrading #PriceAction #TechnicalAnalysis #JCSCharting

18
2,176
$DJIA H4: THE MOST BRUTAL MOVE — 3,000-POINT DROP LAUNCHES WAVE C 🩸
The Dow was the most brutal of them all, and the structural roadmap nailed every single leg.
THE STRUCTURAL READOUT
🚀 +2,500-POINT RALLY INTO WAVE B: Price squeezed violently straight into our red B-wave completion zone on Wednesday, tagging our mapped resistance to the tick.
🩸 -3,000-POINT CRUSH: Yesterday the market witnessed a savage 3,000-point drop directly off our marked turning point.
📉 FINAL WAVE C IS ACTIVE: That collapse officially launched the final wave C of the macro correction that started back at the beginning of August.
Every single level and inflection point was given to members well in advance. Look at the screenshot directly out of our Discord — textbook before-and-after execution at its finest.
#DJIA $YM_F $DIA #FinTwit #DayTrading #PriceAction #TechnicalAnalysis #MarketStructure #ElliottWave #JCSCharting #DowJones

17
2,229

