Just Maps (@JustElexMaps) header
Just Maps (@JustElexMaps) profile picture

Political and demographics maps and statistics from the United States and worldwide. I also run @electionvintage.

United States of America
Joined May 2021
Photo by Just Maps (@JustElexMaps)Photo by Just Maps (@JustElexMaps)Photo by Just Maps (@JustElexMaps)Photo by Just Maps (@JustElexMaps)Photo by Just Maps (@JustElexMaps)Photo by Just Maps (@JustElexMaps)Photo by Just Maps (@JustElexMaps)Photo by Just Maps (@JustElexMaps)Photo by Just Maps (@JustElexMaps)Photo by Just Maps (@JustElexMaps)
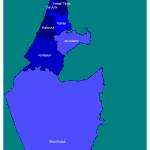
Map of the largest religious group in each of Israel's "natural regions".
2
5
1
143
32,629
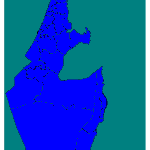
"Natural regions" are the administrative division below "subdistricts" in Israel. Here is % Jewish by natural region. I owe @vatant_ a debt of gratitude for the shapefile - it was not easy to find!
1
22
1,267
Maps of Indigenous ancestry in British Columbia, by provincial riding. The urban/rural divide is pretty striking.
3
1
2
138
17,727
Question for my British followers. Kendal is part of the "Lake District", a tourist destination renown for its beauty. Yet this picture of the town is one of the most dreary, Dickensian things I've ever seen. Is Kendal an outlier in the region? Is this an inaccurate picture?
48
1
10
35
32,901
Does anyone (particularly someone who speaks Hebrew) have any idea where I could find a shapefile of Israel's "natural regions"? This is an administrative division below "subdistrict". Usually Google Gemini is pretty decent at searching Hebrew-language stuff but no luck with this
2
1
3
586
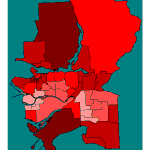
Map of white ancestry in metropolitan Vancouver, by provincial riding.
4
1
1
44
3,822
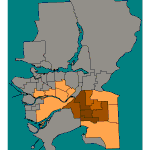
Map of South Asian ancestry in metropolitan Vancouver, by provincial riding.
Replying to @JustElexMaps
Could you do one of Indian ancestry
6
3
91
7,861
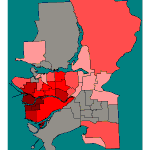
Chinese ancestry by provincial riding in metropolitan Vancouver. #bcpoli
5
5
1
112
7,455
Pie map of religion by Israeli sub-district.
6
109
13,754
Jewish percentage by Israeli subdistrict as of 2022.
4
3
95
28,608
(Please note - I used AI to create the dataset by pulling from Hebrew-language sources on Israel's Central Bureau of Statistics)
3
809
The Hui people are one of the largest ethnic minorities in China. They are defined as all Muslim populations not included in China's other ethnic groups, and speak some form of Chinese rather than minority languages.
1
15
847
Best performing statewide Republican by county in Florida in 2022.
1
7
1
82
8,790
Population change in Kentucky by county from 2000-2020.
1
7
572
Distribution of first-language Kannada speakers in India.
6
424
Shia Muslims are the predominant religious group in Lebanon's northeast and south.
6
473
Population change in Arkansas by county from 2000-2020.
1
1
19
1,253
Lebanon has a prominent Druze population, particularly in the south of the Mount Lebanon governorate and at the border of the Beqaa and Nabatieh governorate.
9
521
Konkani is the primary language of the small Indian state of Goa, but there are several districts in Maharashtra and Karnataka with significant percentages of Konkani speakers.
1
1
13
533
Largest religious sub-group/denomination by Lebanese district, 2022. (This is based on electoral data and not census data - I used AI to obtain it from Arabic language sources).
8
21
3
213
19,835