Justin (@JustinVos) header
Justin (@JustinVos) profile picture

Political Consultant Formerly: City of Dallas Chief of Staff | Texas State Director @MurphyNasica | @ColoGOP | @RPSDC

Kokomo
Joined August 2009
Photo by Justin (@JustinVos)Photo by Justin (@JustinVos)Photo by Justin (@JustinVos)Photo by Justin (@JustinVos)Photo by Justin (@JustinVos)Photo by Justin (@JustinVos)Photo by Justin (@JustinVos)Photo by Justin (@JustinVos)Photo by Justin (@JustinVos)
There are many uniformed people on X when it comes to elections, especially in Texas. I'm getting sick of repeating myself to them consistently so I'm just going to make this thread and then point people to it. How do we determine who a Republican or Democrat is in these models when there is no party registration in Texas? Counties post vote rosters on their websites of everyone who votes in each election (with the exception of a few voters who are exempt such as police officers, judges, etc.) An example is this vote roster from Harris County (FYI: if you click the link below it will download a vote roster): appfiles.harrisvotes.com/har… When someone votes in a Democrat or Republican primary they are shockingly identified as a Democrat or Republican in said model. Most of these models take this data from primaries for multiple cycles. If someone has voted in both Republican and Democrat primaries they're considered a "cross over voter" or "independent", if they voted in a Republican primary 10 years ago and have since voted in Democrat primaries they're considered Democrat. There's a sizeable number of voters who only have voted in General Elections or are new voters, they typically get a "lean" designation based on who they live with. So if they live with a Republican we give them a lean Republican score, if they live with Democrats they get a lean Democrat. Like most things in life none of this is perfect but it's helpful. What are your sources? The best source are the county election pages, unfortunately none of them are uniform. They are supposed to post the roster for those who have voted by 11AM the next day. Some post it at 9PM the day of, some just outright don't post them at all and you need to hassle their offices for the files. Here is an example of where you would find the Fort Bend County Data: fortbendcountytx.gov/governm… Here's Brazoria County's: brazoriacountyclerktx.gov/de… To get the data on all of these you need to go through 254 of these separate sites, email the county clerk asking for the roster, etc.
8
19
9
123
43,831
Here is how voters are turning out in Texas. For Republicans you'd like to see higher turnout in the Exurban, Mid-Sized Metros, Small Metros, and the Rural parts of the state. The one caveat is that going into the last day of Early Voting/Election Day Republicans will have more potential voters they can capture.
5
4
1
26
2,830
TEXAS EARLY VOTE UPDATE: Republicans will once again win the day in Texas. Becoming around 4.5% more Republican than the current running totals. Tomorrow, traditionally has been a strong day for Democrats but it's been a weird year and typical voting patterns have shifted dramatically. We should see increased turnout, although there are storms throughout the state.
22
11
2
106
13,219
All these counties basically shift the same % wise.
1
1
6
1,667
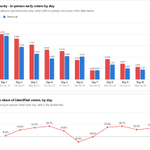
Tarrant County, TX Early Vote (Days 1 - 11) 🗳️ Ballots so far: 529,728 🔴 Republicans: 160,582 (30.3% of all ballots) 🔵 Democrats: 171,157 (32.3% of all ballots) 📊 Margin: D +10,575 R share of identified: 48.4% Latest: R +2,371
6
9
7
100
21,510
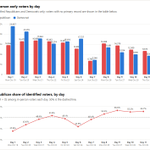
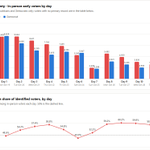
Waiting on a few more counties to report, but it looks like Texas got a little redder today. Will post an update in a bit but as we wait I'll post a few of the bellwether counties Day 11 returns.
5
3
81
3,179
Denton County, TX Early Vote (Days 1 - 11) 🗳️ Ballots so far: 282,756 🔴 Republicans: 59,609 (21.1% of all ballots) 🔵 Democrats: 49,612 (17.5% of all ballots) 📊 Margin: R +9,997 R share of identified: 54.6% Latest (Thu Oct 29): R +589
5
7
1
59
4,472
Collin County, TX Early Vote (Days 1 - 11) 🗳️ Ballots so far: 328,452 🔴 Republicans: 68,356 (20.8% of all ballots) 🔵 Democrats: 55,756 (17.0% of all ballots) 📊 Margin: R +12,600 R share of identified: 55.1% Latest (Thu Oct 29): R +983
6
11
3
69
3,824
Gaines County, TX Early Vote (Days 1 - 10) 🗳️ Ballots so far: 2,452 🔴 Republicans: 880 (35.9% of all ballots) 🔵 Democrats: 89 (3.6% of all ballots) 📊 Margin: R +791 R share of identified: 90.8% Latest (Wed Oct 28): R +68
8
12
1
48
5,394
Jim Wells County, TX Early Vote (Days 1 - 10) 🗳️ Ballots so far: 5,558 🔴 Republicans: 932 (16.8% of all ballots) 🔵 Democrats: 1,828 (32.9% of all ballots) 📊 Margin: D +896 R share of identified: 33.8% Latest (Wed Oct 28): D +39
1
2
1
17
3,860
Cooke County, TX Early Vote (Days 1 - 10) 🗳️ Ballots so far: 8,299 🔴 Republicans: 2,544 (30.7% of all ballots) 🔵 Democrats: 600 (7.2% of all ballots) 📊 Margin: R +1,944 R share of identified: 80.9% Latest (Wed Oct 28): R +80
1
2
14
1,368
Hunt County, TX Early Vote (Days 1 - 10) 🗳️ Ballots so far: 18,563 🔴 Republicans: 7,775 (41.9% of all ballots) 🔵 Democrats: 2,687 (14.5% of all ballots) 📊 Margin: R +5,088 R share of identified: 74.3% Latest (Wed Oct 28): R +418
3
9
47
2,163
Ector County, TX Early Vote (Days 1 - 10) 🗳️ Ballots so far: 15,312 🔴 Republicans: 3,888 (25.4% of all ballots) 🔵 Democrats: 1,513 (9.9% of all ballots) 📊 Margin: R +2,375 R share of identified: 72.0% Latest (Wed Oct 28): R +185
1
6
25
1,333
Grayson County, TX Early Vote (Days 1 - 10) 🗳️ Ballots so far: 32,560 🔴 Republicans: 8,732 (26.8% of all ballots) 🔵 Democrats: 2,883 (8.9% of all ballots) 📊 Margin: R +5,849 R share of identified: 75.2% Latest (Wed Oct 28): R +273
1
7
24
1,419
Galveston County, TX Early Vote (Days 1 - 10) 🗳️ Ballots so far: 87,202 🔴 Republicans: 20,985 (24.1% of all ballots) 🔵 Democrats: 13,877 (15.9% of all ballots) 📊 Margin: R +7,108 R share of identified: 60.2% Latest (Wed Oct 28): R +414
2
9
41
1,951
Brazoria County, TX Early Vote (Days 1 - 10) 🗳️ Ballots so far: 93,077 🔴 Republicans: 26,350 (28.3% of all ballots) 🔵 Democrats: 23,484 (25.2% of all ballots) 📊 Margin: R +2,866 R share of identified: 52.9% Latest (Wed Oct 28): R +84
3
6
41
2,957
Hays County, TX Early Vote (Days 1 - 10) 🗳️ Ballots so far: 76,663 🔴 Republicans: 14,631 (19.1% of all ballots) 🔵 Democrats: 25,378 (33.1% of all ballots) 📊 Margin: D +10,747 R share of identified: 36.6% Latest (Wed Oct 28): D +457
4
4
21
2,601
Montgomery County, TX Early Vote (Days 1 - 10) 🗳️ Ballots so far: 144,859 🔴 Republicans: 54,883 (37.9% of all ballots) 🔵 Democrats: 17,778 (12.3% of all ballots) 📊 Margin: R +37,105 R share of identified: 75.5% Latest (Wed Oct 28): R +3,569
4
17
1
79
4,630
Harris County, TX Early Vote (Days 1 - 10) 🗳️ Ballots so far: 820,979 🔴 Republicans: 195,744 (23.8% of all ballots) 🔵 Democrats: 298,824 (36.4% of all ballots) 📊 Margin: D +103,080 R share of identified: 39.6% Latest (Wed Oct 28): D +5,890
8
6
1
30
9,606