

Next-gen Layer 1 analytics & quantitative scoring framework. Comparing blockchain efficiency, performance & economic metrics in real time. Data-driven FA
On-chain
Joined September 2026
- Tweets157
- Following58
- Followers50
- Likes82




Pinned Tweet
The standard for Layer 1 fundamental analysis has officially arrived.
Keptra is LIVE.
We believe that evaluating a blockchain shouldn't rely on hype or vanity metrics. That’s why we engineered a proprietary quantitative framework to score every L1 based on what truly matters under the hood.
🌐 Decentralization — Validator distribution & network resilience.
🛡️ Security — Protocol robustness & protection layers.
📈 Scalability — Economic throughput & capacity.
⚡ Speed — Finality & execution performance.
🤝 Democratization — True accessibility and participation.
No guesswork. Just objective, data-driven intelligence open to everyone.
🔗 Start analyzing now 👇
Network age, the longest-running L1s we track.
bitcoin:native has been running for 17.9 years.
litecoin:native follows at 15.1 years & ripple:native sits at 14.5 years.
Age alone does not equal security or adoption. It does mean these networks have absorbed more upgrades, more economic pressure, and more real-world usage than almost anything else on the list.
Most of the top 15 launched between 2011 and 2018. The gap between the oldest and the youngest in this ranking is almost a decade.
How much do you weigh continuous uptime and historical stress-testing against newer designs when you evaluate a chain?

1
61
Capacity in use - how close networks sit to their own published ceiling.
internet-computer:native is currently running at 80.26% of its published throughput limit.
ripple:native and bitcoin:native follow at 39.39% and 32.99%.
Most of the rest of the list sits well below 20%. Running close to a published ceiling is rare. Most networks stay far under the numbers they advertise.
Scalability is 20% of the Keptra Score. This metric shows how much of the stated capacity is actually being used under live conditions.
Do you treat a high utilization number as a sign of real demand, or as a warning that headroom is disappearing?

35
Nodes in the Nakamoto set
elrond-erd-2:native leads with 1,094 nodes in its Nakamoto set.
The rest of the ranking drops from 445 down to 27.
The Nakamoto set is the smallest group of nodes that together control enough stake to disrupt consensus. A larger set means more independent operators have to coordinate before the network can be meaningfully affected.
Decentralisation is 25% of every Keptra Score. This is one of the inputs that actually measures how hard it is for a small group to control the chain.
How much weight do you put on the size of the Nakamoto set versus the total number of validators when you look at a network?

1D trading volume growth
elrond-erd-2:native is up 261.49% over the last day.
internet-computer:native and solana:So11111111111111111111111111111111111111112 follow at +114.32% and +97.72%.
The rest of the list sits between +91% and +38%. One-day moves this size are almost always driven by a short-term catalyst rather than a structural shift in activity.
Volume can spike for many reasons. Sustained higher volume is rarer.
Which of these three do you actually see more activity on right now, or is this mostly noise?

Staking APR, top 15 networks we track.
The highest 3, cosmos:native ethereum:0x6ad12e761b438bea3ea09f6c6266556bb24c2181 & elrond-erd-2:native rate currently sits between 15.54% and 9.11%.
Everything else falls between that and 2.50%.
APR is only the headline number. What actually matters is how that rate is generated: emissions, real fees, or a mix of both, and how sustainable it is once inflation and lock-up terms are factored in.
Most rankings stop at the percentage.
The useful question is what sits underneath it.
Do you treat high APR as a signal, or as something that needs a second look at inflation and participation rate?

Which L1s have hit the highest throughput we have measured?
elrond-erd-2:native internet-computer:native & solana:So11111111111111111111111111111111111111112 are leading the way.
Since we started tracking on 1 September 2026, the peak observed sits at 18,293.3 tx/s.
The 15th place is at 653.3 tx/s.
That’s a ~28× gap between the top of the ranking and the bottom of the top 15, all from live data, not theoretical ceilings.
Scalability is 20% of every Keptra Score. Throughput is the part of it that shows what a network has actually delivered under real load.
What do you think drives these observed peaks more, chain design, demand, or both?

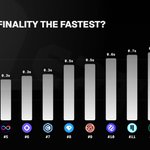
Which L1s reach finality the fastest?
aptos:native elrond-erd-2:native & iota:native are leading the way.
The top of this ranking sits at 0.1s. The bottom of the top 15 is at 1.0s.
That’s a 10× spread on a metric that carries 15% weight in every Keptra Score.
Speed is one of the five pillars. Finality is the part of it that decides when an application can treat state as irreversible without reorg hedging.
How much does sub-second finality actually change the use cases you care about?

3,221 nodes on @MultiversX as of Nov 1.
The count moved between a low of 3,184 on Sep 27 and a peak of 3,232 on Oct 18, ending up 0.5% higher since Sep 7. 📉
What keeps elrond-erd-2:native validator count this steady over two months?

$137.84M @cryptocom stablecoin supply hit a 3-month low in the week of Oct 26.
After peaking at $189.43M in the week of Sep 21, crypto-com-chain:native stablecoin volume is down 23.2% since the week of Aug 10.
Where do you think this stablecoin liquidity is heading?

40


We’ve been offline for the last 3 days due to an account recovery.
Everything is sorted now and we’re back.
Appreciate the patience. 🙏
1
20
ethereum:0x6810e776880c02933d47db1b9fc05908e5386b96 averaged 72,203 new accounts a day in the week of Oct 12 so far, up +86.4% from the week of Oct 5 to reach a three-month peak.
→ Daily account creation is up +245.6% since the three-month low of 20,891 in the week of Sep 7.
→ New account growth climbed steadily through September, moving from 31,155 in the week of Sep 14 to 35,469 in the week of Sep 21, then reaching 46,630 in the week of Sep 28.
→ A temporary drop to 38,744 in the week of Oct 5 interrupted the upward trend before activity surged this week.
→ The latest weekly average of 72,203 accounts per day sits well above every other weekly period measured over the last three months.
What is driving this sudden surge in new wallet creation on @gnosischain?

2
2
67
the-open-network:native circulating supply reached a peak of 2.8B in the week of Oct 12, putting the token up +12.2% over the 12-month window.
• The week of Oct 12 sits at 2.8B so far, up +0.2% on the week of Oct 5
• Current levels sit at the annual peak, climbing away from the low of 2.4B logged in the week of Dec 29
• Supply held flat at 2.5B through most of spring before stepping up across May and August
• The move marks steady net unlocks across the year rather than sudden single-week surges
Can @ton_blockchain secondary market liquidity absorb steady emissions of this pace without denting demand?

Keptra retweeted

✅The #AI era is not just about paradise or apocalypse, but how we choose to build the future with @beniaminmincu and @MultiversX in the conversation.
#UpGrade100 & #IQDigital 2026
facebook.com/share/p/1FCzRhk…


$INJ hit a peak of 3.1B transactions ever on Oct 15, up 4.8% since Sep 16.
Activity has held steady at the 3.1B mark for two straight weeks.
What is driving most of @injective contract calls right now?

1
31
12.8M transactions a day for @SuiNetwork on Oct 14, up 24.2% from Oct 13.
Peak was 13.1M on Sep 21 and low was 8.3M on Sep 26, with a 40.6% change since Sep 15.
Which chain would you put next to sui:native on this chart?

2
33