

Ex Silicon Valley software engineer; developed Paypal’s recurring billing system, https://nitter.cf/t.co/sJN4uzT9LG fraud controls, CredMe. Mitnick's accomplice. Shameless capitalist.
Boise (ID) and Malaga (Spain).
Joined April 2013
- Tweets11.2K
- Following866
- Followers7.5K
- Likes14.1K




Pinned Tweet
Here it is... what many have been waiting for; a clear path forward for both new and intermediate traders, and a thriving community for advanced traders wishing to learn more. Everyone, regardless of level, can now join the EdgeByRS server and get access to not only my Savant Trading live chart stream and commentaries, but also the full EdgeByRS curriculum for new and intermediate traders. That's right... a path forward, all for one membership fee, on one discord server.
You can obtain a substantial discount by viewing the video I've prepared for you, and following the instructions. You're also welcome to skip the video and pay full price, of course - but I wouldn't.
Am I good at marketing? Laughably, no! Am I good at markets? Yes! What do you want... a person good at marketing, or a person good at markets? Watch the video; take the discount, and come under our joint mentorship wing.
youtu.be/TxOJJkNDp0U

Like a solar eclipse, this event was streamed live to the members of our discord. I posted about it afterward, so members who sleep during Globex could learn about it in the morning.


Did you catch the STO (short) at 7613 that yielded 25 points ($1,250 per contract)? Traders with access to my stream did, and much more. If you're waiting for another special offer before joining, so you can save $45/month, think about what it's costing you.


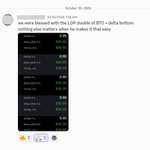
Some folks in our discord are still talking about how easy it was for them to identify Friday's bottom, given what the LDP (Lewis De Payne) stream told them. In reality, it's not that easy - you need to take the initiative, commit, and learn the material.


Enjoy the confluence offered by RS in his Friday video as he shares 3 bearish clues. Between my bimodal scalping and his swing trading, we offer a hybrid strategy that combines the best of both worlds. Learn his 3 bearish clues, then review my posts to see the confluence!

Trend days are where most traders get it wrong.
Friday's $ES gave 3 bearish clues before the bell:
→ Gap down
→ Open below last week's Weekly VAL
→ Balance breakdown (RS Custom Balance Range)
Full walkthrough: the context, the entries, and how intraday singles warned the move was about to accelerate 🎥
Bookmark this for your next trend day. 🔖
#ES_F $ES_F $SPX
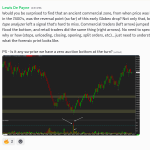
What happened at the tumultuous low of 7560? One of our students called the turn around, using my streaming chart. I reinforced with my own comment, and let price do the rest. Don't miss next time - our special offer ends November 1st. See my pinned profile post.


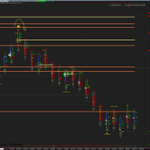
These are very old commercial liquidity zones, given how far down they are... yet notice how price responds when in their vicinity, even now. Folks in our discord have access to these tools and more. See pinned post on my profile for details, while there's still time.

The more time you spend pondering "is this the final bottom" the closer we get to November 1st, when the two-for-one discounted offer to join our discord expires. Even if it's not the final bottom, you could have taken advantage of the scalps along the way...


Here it is... what many have been waiting for; a clear path forward for both new and intermediate traders, and a thriving community for advanced traders wishing to learn more. Everyone, regardless of level, can now join the EdgeByRS server and get access to not only my Savant Trading live chart stream and commentaries, but also the full EdgeByRS curriculum for new and intermediate traders. That's right... a path forward, all for one membership fee, on one discord server.
You can obtain a substantial discount by viewing the video I've prepared for you, and following the instructions. You're also welcome to skip the video and pay full price, of course - but I wouldn't.
Am I good at marketing? Laughably, no! Am I good at markets? Yes! What do you want... a person good at marketing, or a person good at markets? Watch the video; take the discount, and come under our joint mentorship wing.
youtu.be/TxOJJkNDp0U
Step by step, I explain where and why the short from the interim top developed, and where it started to play out. Once the signal and confluence aligned, it was a GO. The short went from 7756 to 7726 (30 points, $1,500 per contract) so far. See pinned post on my profile for more.


The non-correlated confluence between an @EdgebyRS chart (light) and Savant chart (dark) is uncanny. One tells you when you're in a zone of interest, the other tells you when it's time to make your move. Here, sharp T10 shift from extrema plus flow lines provide all the help you need. See pinned post for details on watching this live.


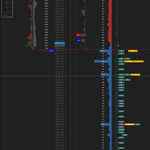
Final post for the day... I literally "hand hold" by showing folks where price is going to target liquidity (on my DOM chart). On the footprint, it showed up as an absorption of retail traders. On the tape analyzer, you could literally see where retail was being pushed, before the rug pull. You can join us live for all this - see pinned post.


The big catch, however, was the long signal (yellow square) from Old Faithful algo, along with the manual retest and bounce of that prior long zone. See my pinned post for details on the live stream.

Voltic short announced, followed by voltic long (via audio alerts); in both cases, the LOB reshuffle gave us advanced notice of possible moves. See my pinned post if you want to see (and hear) these things on the live stream.

7760 liquidity zone identified while price was at 7767... and 7760 liquidity zone attained (plus a bit more). Don't bother with the naysayers - they don't know the rules for when liquidity attracts, when it repels, and when it's just a zero burger. See pinned post for details on joining us live.

Today on live stream, I pointed out a liquidity target at 7750 when price was still at 7712. We then watched price reverse and exceed that target - a 45+ point move (to my target), or $2,250 per contract. See my pinned post if you want to watch this live.


At times, the Old Faithful algo is quite perceptive. Here, it tells me to favor a short (the square with the dashed purple tracer line). This ends up running down to 7711 before a zero auction bottom develops. What is of most interest here? A lot of sideways consolidation prior to that short, and she didn't chop out.

With charts streaming live, our members saw the short top develop, the long bottom, and the push back up. They avoided shorting the question mark, and I explained why. If you want to explore further, see my pinned post while time is still on your side.


As I explained in the group: Back to the question mark, above... we see the upper structure, and now we get a series of lower highs, each with a zero auction top and [S1]hort signals... but we know this isn't our first visit here... it's a retest of a prior failed push. If it can't break through, and it doesn't fall precipitously, it's going to either slowly bleed sideways (and I don't like being exposed in an open trade just waiting for resolution) or consolidate... so not my type of short, even though this bastard makes T1 and qualifies.
