

Quantitative Researcher || Systematic Trading & HFT || Computational & Applied Mathematics https://nitter.cf/t.co/vAhv99BH0m
Joined December 2021
- Tweets820
- Following517
- Followers214
- Likes6.2K




Pinned Tweet
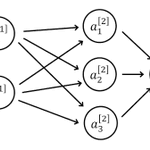
The systematic research loop: Observation → Hypothesis → Data → Testing → Backtesting → Robustness → Portfolio Construction → Execution.
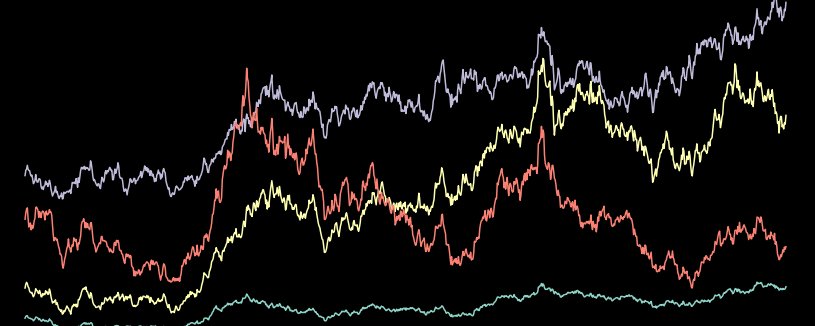
Building a Quantitative Trading System: Research Meets Engineering
Building a quantitative trading system involves much more than developing a strategy that can identify profitable opportunities in the market.
There are two major parts to it:
1. Systematic Research
This is where the trading ideas come from.
It involves studying market behaviour, developing mathematical and statistical models, identifying patterns, testing hypotheses, building trading signals, portfolio construction, risk modelling, and backtesting strategies.
The objective is to find a systematic approach that can identify and exploit opportunities in the market while properly accounting for risk, transaction costs, and market conditions.
2. Trading Infrastructure
Having a good strategy is one thing. Being able to execute it reliably in a live market is another.
This is where trading infrastructure comes in.
It involves building the systems responsible for order execution, market data processing, networking, exchange connectivity, portfolio and risk management, monitoring, logging, and system reliability.
It also involves engineering decisions around latency, concurrency, memory management, and fault tolerance, particularly in high-frequency and low-latency trading environments.
Both sides are equally important.
A good research model can fail in production because of poor execution, unreliable infrastructure, or inadequate risk controls.
Similarly, having highly optimised trading infrastructure means very little if the underlying strategy has no statistical edge.
Ultimately, quantitative trading sits at the intersection of mathematics, statistics, finance, and software engineering.
You need both the research to find an edge and the engineering to execute it effectively.

Pricing Techniques in Quantitative Finance
How do quants determine what a financial instrument is actually worth?
There is no single approach. The technique depends on the asset, the model assumptions, and the problem being solved.
A few important methods:
• Black-Scholes: Analytical pricing for European options under specific assumptions.
• Monte Carlo Simulation: Estimates prices by simulating possible future paths of an underlying asset.
• Finite Difference Methods: Numerically solve pricing PDEs, especially for derivatives with complex features.
• Binomial & Trinomial Trees: Model possible price movements across discrete time steps.
• Fourier Methods: Efficiently price certain options using characteristic functions, particularly in models such as Heston.
• Numerical Integration: Computes prices when closed-form solutions are unavailable or impractical.
The interesting part is that a pricing model is only as useful as its assumptions, calibration, and implementation.
In quantitative finance, knowing the theory matters. Knowing how to implement it, test its accuracy, and understand its limitations matters just as much.
#QuantFinance #DerivativesPricing #QuantResearch
Currencies: More Than Just Exchange Rates
In quantitative trading, currencies are more than pairs moving up and down on a chart.
FX markets are influenced by interest rate differentials, inflation, central bank policies, capital flows, and changes in global risk sentiment.
For a quant, the goal is to understand how these factors interact, identify patterns in the data, and determine whether those patterns offer a genuine, exploitable edge.
But finding a pattern is only the beginning.
Transaction costs, liquidity, execution, and changing market regimes can turn a seemingly profitable strategy into a losing one.
The real challenge isn’t predicting where a currency will move. It’s finding a repeatable edge and proving that it survives real market conditions.
#QuantitativeFinance #AlgorithmicTrading #FXTrading #SystematicTrading
Why do firms like Jane Street and Citadel have an edge over retail traders?
It goes far beyond having more money.
Large trading firms have access to better infrastructure, high-quality market data, sophisticated pricing models, and teams of researchers and engineers working together to solve difficult problems.
They invest heavily in execution speed, risk management, market microstructure research, and technology that helps them understand and respond to market conditions.
They also benefit from economies of scale. They can spread infrastructure costs across large trading operations and invest in research that would be too expensive for most individuals.
But here’s the interesting part: having more resources doesn’t automatically mean having an edge.
An edge comes from how effectively those resources are used to identify opportunities, manage risk, and execute trades.
Retail traders can still find opportunities, especially in less competitive markets or strategies that don’t require expensive infrastructure.
The real difference is that competing with institutional firms on their strongest ground requires much more than a good strategy.
It requires research, engineering, data, execution, and risk management working together.
In modern quantitative trading, the model matters, but the entire system behind it matters just as much.
Trading Infrastructure: The Engineering Behind Quantitative Trading
When people talk about quantitative trading, they usually focus on mathematical models, strategies, and finding alpha.
But there is another side that is just as important: trading infrastructure.
A good strategy is only one part of the equation. You also need reliable market data pipelines, efficient backtesting engines, low-latency execution systems, risk management, and monitoring.
Think about it. What happens when your data feed drops, your order gets delayed, or your execution engine fails during a volatile market?
These are not just software engineering problems. They directly affect your PnL.
This is why quantitative trading sits at the intersection of mathematics, statistics, computer science, and systems engineering.
The goal is not just to build a model that identifies an opportunity. It is to build a system that can identify, evaluate, and execute that opportunity reliably under real market conditions.
Finding alpha is difficult. Building the infrastructure to capture it consistently is another challenge entirely.
And in competitive markets, both matter.
AI is changing systematic trading and HFT, but the real challenge goes beyond building better models.
There are deeper engineering problems to solve. How do we process massive amounts of market data with minimal latency? How do we build reliable trading systems that can make decisions in milliseconds? How do we use AI without introducing unnecessary complexity or risk?
Building a model is one thing. Turning it into a reliable, efficient trading system that works in real markets is another.
I think the real opportunity lies at the intersection of AI, quantitative research, and systems engineering.
Measure Theory in Quant Finance: How Important Is It Really?
Measure theory is one of those subjects every aspiring quant eventually encounters. But how important is it in practice?
Let's talk about where it matters, where it doesn't, and what you should focus on.
Where measure theory actually matters
If you work in derivatives pricing, stochastic calculus, or mathematical finance, measure theory is more than abstract mathematics.
It provides the foundations for understanding:
Risk-neutral pricing and changes of probability measure.
Conditional expectations and martingales.
Brownian motion and stochastic integration.
Stochastic differential equations.
The mathematical foundations of arbitrage-free pricing.
For example, when pricing derivatives, we often work under a risk-neutral probability measure. Understanding why this approach works, when it is valid, and how we move between probability measures requires a deeper understanding of probability theory and measure theory.
Where it becomes practically useful
Measure theory becomes particularly valuable when you're doing original research rather than simply applying existing models.
Suppose you're developing a stochastic volatility model, studying exotic derivatives, or investigating the theoretical properties of a new pricing method.
You need to understand the assumptions behind your model, the properties of the stochastic processes involved, and the conditions under which your results hold.
This is where measure-theoretic probability becomes useful. It helps you distinguish between what you can prove, what you can reasonably assume, and what still needs to be investigated.
Where measure theory is less important
Let's be honest.
If you're developing a momentum strategy, implementing a mean-reversion model, building a backtesting engine, or training a machine learning model to forecast returns, you may rarely use measure theory explicitly.
Your daily work will probably involve:
Statistical inference and time-series analysis.
Feature engineering and model selection.
Market microstructure and execution costs.
Backtesting methodology and risk management.
Programming, data engineering, and optimization.
You can build useful trading strategies without proving advanced theorems in measure theory.
That doesn't mean the theory is irrelevant. It means its practical importance depends on the problems you're trying to solve.
Understanding theory versus using theory
There is a difference between understanding the mathematical foundations of a method and explicitly using those foundations in your daily work.
A researcher developing a new stochastic volatility model may need measure-theoretic probability to justify the framework.
Another researcher investigating statistical arbitrage may never need to work directly with sigma-algebras.
Both can conduct rigorous quantitative research.
Their mathematical requirements simply differ because their research questions differ.
So, should you learn measure theory?
My advice is straightforward.
If you're interested in derivatives pricing, stochastic calculus, mathematical finance, or advanced theoretical research, learn it properly.
If you're focused on systematic trading, statistical arbitrage, or machine learning for trading, prioritize probability, statistics, optimization, and empirical research. Develop your understanding of measure theory as you encounter models and problems that require it.
If you want to move between these areas, a strong foundation in measure-theoretic probability will serve you well.
The goal isn't to learn the most advanced mathematics possible.
It's to understand the mathematics that helps you solve the problems you care about.
Measure theory provides important foundations, but your research determines how deeply you need to use them.
What do you think? Is measure theory underappreciated in quantitative finance, or do aspiring quants sometimes spend too much time on theory before learning how to conduct empirical research?
AI Trading Agents: The Future of Systematic Trading?
AI trading agents are becoming an interesting area of quantitative finance.
But what exactly are they?
A traditional trading algorithm follows predefined rules. An AI trading agent can go further by observing market conditions, processing information, evaluating possible actions, and adapting its decisions within a defined framework.
Imagine an agent that can:
• Analyse market data and identify potential trading opportunities.
• Detect changing market regimes.
• Combine price action with macroeconomic data.
• Generate and evaluate trading signals.
• Manage risk and adjust positions within predefined limits.
• Monitor its performance and flag when a strategy begins to deteriorate.
But here is the important part.
An AI agent is not automatically a profitable trader.
It can overfit historical data, misinterpret market conditions, execute poor decisions, and lose money just like any other system.
That is why quantitative research remains essential.
We still need statistical validation, realistic backtesting, transaction cost modelling, risk management, and continuous monitoring.
And in high-frequency trading, where latency and market microstructure matter, adding an AI agent does not automatically give you an edge.
The real opportunity is not simply building an AI that trades.
It is building a system that can research, evaluate, execute, and monitor trading strategies within a carefully designed framework.
The future of systematic trading may not be just about better models, but about building better systems around them.
#QuantitativeFinance #AlgorithmicTrading #AI #SystematicTrading #HFT
Why Macroeconomics Matters in Quant Trading
You can build a sophisticated statistical model, find patterns in historical data, and backtest a strategy that looks profitable.
But do you understand the economic forces driving the market you’re trading?
Macroeconomics matters because financial markets don’t operate in isolation.
Here are a few things every quant trader should pay attention to:
1. Interest Rates
Central bank decisions influence borrowing costs, bond yields, currencies, and asset valuations. Interest rate differentials are particularly important in FX markets.
2. Inflation
Inflation data can change expectations about future monetary policy, affecting bonds, equities, currencies, and commodities.
3. Employment Data
Employment reports provide information about economic strength and can influence expectations about interest rates and central bank decisions.
4. Central Bank Policy
The Fed, ECB, and other central banks can influence markets through rate decisions, forward guidance, and liquidity conditions. Sometimes, what markets expected matters more than the announcement itself.
5. Economic Growth
GDP, business activity, and consumer spending help us understand the broader economic environment and how different assets might respond to changing conditions.
6. Market Regimes
Markets don’t behave the same way all the time. A strategy that works during a low-volatility environment might struggle during a financial crisis or a period of aggressive monetary tightening.
Understanding macroeconomic conditions can help quants investigate these regime changes.
So, how does this connect to quantitative trading?
Macro data can be used to build trading signals, model economic relationships, identify market regimes, and test how strategies perform under different conditions.
For example, when researching EUR/USD, looking at the interest rate outlook of both the US and the Eurozone can provide useful context for understanding currency movements.
But here’s the important part:
Knowing the macro story doesn’t automatically give you an edge.
The real work is measuring how economic information affects prices, determining what the market has already priced in, and testing whether that information provides a reliable trading signal after costs.
Macro gives you context. Statistics helps you test it. Quantitative research helps you determine whether it’s tradable.
#QuantFinance #Macroeconomics #QuantTrading #FXTrading #QuantResearch
Statistics in Quant Trading: What Actually Matters?
If you want to understand quantitative trading, these are some of the most important areas of statistics to learn and where they come in.
1. Descriptive Statistics
Mean, variance, standard deviation, skewness, and kurtosis. Useful for understanding returns, volatility, and the distribution of market data.
2. Probability Theory
Expected value, conditional probability, and probability distributions. Essential for modelling uncertainty, evaluating trading opportunities, and estimating potential outcomes.
3. Time Series Analysis
Autocorrelation, stationarity, ARIMA, and GARCH. Used to study price and return behaviour, volatility clustering, and temporal patterns in financial markets.
4. Statistical Inference
Hypothesis testing, confidence intervals, and p-values. Helps determine whether a strategy’s performance is statistically convincing or could simply be due to chance.
5. Regression Analysis
Linear regression, logistic regression, and regularisation. Used in factor modelling, return prediction, and understanding relationships between financial variables.
6. Bayesian Statistics
Bayesian inference and updating probabilities. Useful for incorporating new information, estimating uncertain parameters, and modelling changing market conditions.
7. Multivariate Statistics
Covariance, correlation, and principal component analysis (PCA). Important for portfolio construction, risk management, and identifying common factors driving asset returns.
8. Extreme Value Theory
Tail distributions and extreme quantiles. Helps quantify tail risk and analyse rare market events that ordinary risk models may underestimate.
9. Nonparametric Statistics
Bootstrapping, kernel density estimation, and rank-based methods. Useful when you don’t want to rely entirely on assumptions about the underlying distribution of financial data.
10. Statistical Learning
Cross-validation, regularisation, and feature selection. Helps develop predictive models while reducing overfitting and testing whether signals generalise to unseen data.
One thing to remember: finding a statistical pattern in financial data doesn’t automatically mean you’ve found a profitable trading strategy.
Transaction costs, slippage, overfitting, and changing market conditions still matter.
That’s where statistical knowledge meets actual quant research.
#QuantFinance #QuantTrading #Statistics #QuantResearch
Why prediction and pricing are a quant’s job.
Trading is not just about predicting where the market will go. It’s also about knowing what an asset is worth and whether the price you’re seeing makes sense.
These are two different problems, and both sit at the heart of quantitative finance.
1. Prediction: What happens next?
Will volatility increase? Is this price movement likely to continue? Is there a statistical relationship between two assets that we can exploit?
This is where time series analysis, statistical learning, econometrics, and stochastic models come in.
The goal isn’t to predict the future perfectly. It’s to find a statistical edge that survives real market conditions.
2. Pricing: What is this asset worth?
How much should a European option cost? What is the fair value of a derivative? How should we price an asset when volatility is stochastic?
This is where probability theory, stochastic calculus, numerical methods, and partial differential equations become useful.
Think of the Black-Scholes model, the Heston model, or Monte Carlo simulation.
You’re not simply guessing a price. You’re building a mathematical framework around uncertainty, market assumptions, and risk.
Here’s the interesting part.
Prediction and pricing are not the same thing.
An asset can be correctly priced even when you don’t know where its price will go next. Likewise, you can predict a price movement correctly and still lose money if the trade is poorly priced or the transaction costs are too high.
This is why quantitative finance goes beyond finding patterns in charts.
It combines mathematics, statistics, computation, and financial theory to answer two fundamental questions:
What is this asset worth, and is there an opportunity in the market?
That is where being a quant becomes valuable.
#QuantFinance #QuantTrading #QuantResearch #DerivativesPricing #SystematicTrading #MathematicalFinance
Statistical Distributions in Quant Finance: Where Do We Actually Use Them? 📊
In quantitative finance, knowing a probability distribution is one thing. Knowing when to use it is another.
Different problems require different assumptions. Here are some distributions you’ll come across in quant research and what they’re actually used for.
1. Normal Distribution
Used in classical statistical modelling, factor models, and as a starting point for modelling returns.
The problem? Financial returns often have heavier tails than the normal distribution assumes. Extreme market moves happen more often than a simple Gaussian model would suggest.
2. Lognormal Distribution
This comes up in derivatives pricing, particularly in the Black-Scholes model.
Under the model’s assumptions, an asset’s future price follows a lognormal distribution under the risk-neutral measure. This keeps the price positive.
3. Student’s t-Distribution
Useful when modelling data with heavier tails than a normal distribution.
In finance, it can help capture the tendency of returns to produce extreme observations more frequently than a Gaussian model predicts.
4. Poisson Distribution
Used to model the number of events occurring within a given time interval.
Think of trade arrivals, order-flow events, or jumps in a basic jump-diffusion model.
5. Exponential Distribution
Useful for modelling waiting times between events in a Poisson process.
For example, you could use it to model the time between trades, assuming the event arrival rate is constant. Real markets, however, can be more complicated.
6. Gamma Distribution
Used to model positive-valued variables and waiting times until multiple events occur.
It also appears in financial modelling, including the variance process used in the Variance Gamma model.
7. Beta Distribution
Useful for modelling quantities between 0 and 1.
For example, in Bayesian analysis, you could use it to model uncertainty about the probability that a trading strategy produces a profitable trade.
8. Generalized Extreme Value (GEV) Distribution
When you’re interested in extreme market movements, this is worth knowing.
It’s used in extreme value theory to model block maxima, making it useful for studying unusually large losses and market moves.
For modelling losses that exceed a chosen threshold, the Generalized Pareto Distribution is another important tool.
One thing worth remembering: there is no single distribution that works for every problem in quantitative finance.
The distribution you choose for derivatives pricing might not be appropriate for modelling trade arrivals or extreme losses.
Understand the problem first. Then choose your model, test its assumptions, and see how well it holds up against real data.
That’s where the real quantitative work begins.
Quantitative Trading Psychology: Models Don't Panic, People Do.
One thing I find interesting about quantitative trading is that, even when your decisions are driven by data, models, and statistics, human psychology still plays a huge role.
There's an idea that history doesn't repeat itself, but human nature does.
Markets change. Technology evolves. New instruments emerge. But fear, greed, overconfidence, and the desire to make quick money remain very much the same.
And these behaviours can influence how people trade, how they manage risk, and how they react when things don't go as planned.
Think about it.
You can spend months developing a strategy, testing it on historical data, and getting promising results. But when the strategy starts losing money, you may begin to doubt your own research.
You might abandon it too early, change parameters just to improve the backtest, or keep adding features because you don't want to accept that your original hypothesis was wrong.
This is where psychology becomes important.
A model doesn't feel fear after five consecutive losses. It doesn't get excited after a profitable week or become overconfident after a good backtest.
But the person managing that model does.
And if you're not careful, your emotions can influence the very decisions your quantitative process was designed to make more objective.
This is also part of what makes systematic trading interesting. Hedge funds and trading firms can generate substantial profits by identifying market inefficiencies, managing risk, and exploiting opportunities that others overlook. Some strategies even take advantage of predictable patterns in market participants' behaviour.
But none of this means that quantitative funds are immune to mistakes. They can overfit models, misjudge risk, underestimate transaction costs, or assume that historical relationships will continue to hold.
A mathematical model doesn't automatically eliminate human error. Sometimes, it simply gives that error a more sophisticated appearance.
A few things every quant should remember:
• Don't fall in love with your model. The time you invest in an idea doesn't make it correct.
• A good backtest doesn't guarantee future profits. The results may reflect noise, overfitting, or assumptions that won't hold in live markets.
• Don't confuse a losing trade with a bad decision. Probability doesn't guarantee that every outcome will go your way.
• Know when to question your strategy. Discipline doesn't mean blindly trusting a model when the evidence suggests something has changed.
• Be honest about uncertainty. Markets evolve, relationships break down, and even well-researched strategies can fail.
At the end of the day, quantitative trading is about more than mathematics, statistics, and programming. It's also about understanding uncertainty, recognising our own biases, and building processes that reduce the impact of human mistakes.
History may not repeat itself exactly, but human behaviour often follows familiar patterns.
And perhaps one of the biggest challenges in quantitative finance is learning to recognise those patterns without becoming convinced that we can predict everything.
Models don't panic. People do. The real challenge is making sure the people behind the models don't become the biggest source of risk.
#QuantFinance #QuantResearch #SystematicTrading
1/4
📊 Can you build a profitable gold trading strategy by modelling short term mean reversion?
I wanted to investigate this question using XAU/USD, not by relying on chart patterns or simply guessing where price might go next, but by building a systematic framework around the statistical behaviour of gold.
The idea was to estimate gold's changing equilibrium using a causal Kalman filter, then model deviations from that equilibrium using an Ornstein–Uhlenbeck process.
In simple terms, I wanted to test whether unusually large deviations in gold's price could create trading opportunities when the price moved back towards its estimated equilibrium.
I used around five years of hourly XAU/USD data, incorporated trading costs, and evaluated the strategy using walk forward validation.
But there was a catch.
A market can exhibit mean reversion statistically without offering a profitable trading opportunity after costs.
I wanted to find out whether the numbers supported the idea.
Here's what the experiment revealed. 🧵

3/4
One finding stood out when I broke down the results by trade direction.
The strategy treated long and short mean reversion trades symmetrically. But the outcomes were anything but symmetrical.
🟢 Long trades
133 trades
60.2% win rate
+$6.29 average net P&L per trade
🔴 Short trades
131 trades
50.4% win rate
−$218.92 average net P&L per trade
Almost all the losses came from the short side.
Gold experienced a strong upward trend during much of the sample, and repeatedly betting on downward deviations to reverse proved costly under these rules.
This highlighted an important research question: should a mean reversion strategy treat both directions equally when the market's behaviour and broader trend are asymmetric?
It also shows why aggregate metrics can hide important information.
Looking at the overall Sharpe ratio tells you that the strategy struggled. Breaking down the trade log helps explain where that struggle came from.
The next step is not simply to keep adjusting parameters until the backtest looks good. It's to investigate whether the asymmetry is robust and whether a more selective short side can improve out of sample performance.

4/4
So, did the experiment work?
The answer depends on what we're measuring.
Statistically, the residual spread showed evidence of mean reversion. The fitted Ornstein–Uhlenbeck half life was approximately 12.5 hourly bars, or around 12 hours.
Economically, however, the strategy failed to turn that behaviour into a profitable trading edge after realistic costs.
That's the distinction I wanted to investigate.
A statistical relationship can be real without being sufficiently profitable to trade. Execution costs, risk, market direction, and out of sample performance all matter.
For the next stage, I want to investigate three things:
Separate long and short model parameters rather than assuming both sides behave identically.
Test a slower trend filter that could reduce short exposure during sustained gold uptrends.
Rework the regime filter and verify that it actually responds when market conditions change.
These are research hypotheses, not fixes I can assume will work. Each one needs to be tested independently and evaluated out of sample.
I'm sharing this because quantitative research isn't just about presenting profitable backtests. It's about asking a clear question, testing it carefully, understanding the evidence, and being honest about what the results do and don't support.
The strategy isn't ready for deployment, but the experiment has given me a clearer direction for the next iteration.
Back to the research. 📈
Follow for more quantitative Research and Trading content like this 👍
#QuantFinance #QuantTrading
Quantitative Investment vs Quantitative Trading: What’s the Difference?
People often use these two terms interchangeably, but they are not exactly the same thing.
Both use mathematics, statistics, data, and computer models to make financial decisions. The main difference is often what they are trying to achieve and how they approach the market.
1. Quantitative Investment
The main focus is deciding where to allocate capital to generate returns over time.
A quantitative investment team might build models to rank stocks, identify undervalued assets, forecast returns, manage portfolio risk, or decide how much capital to allocate to different markets.
For example, a model might identify 50 stocks with attractive characteristics and build a portfolio designed to outperform the market over the next year.
The focus is often on portfolio construction, expected returns, risk, and long term performance. But quantitative investing can also involve frequent rebalancing and short holding periods.
2. Quantitative Trading
The focus is developing systematic strategies that identify trading opportunities and determine when and how to execute trades.
This could involve statistical arbitrage, market making, order flow analysis, momentum, mean reversion, or high frequency trading.
For example, a trading model might detect a temporary price discrepancy between two related assets and automatically trade them before the opportunity disappears.
Here, execution, transaction costs, market microstructure, risk management, and the speed at which an edge disappears can be extremely important.
So, what is the real difference?
Quantitative investment is often more focused on portfolio allocation and generating returns from a collection of investment decisions.
Quantitative trading is often more focused on identifying and exploiting specific market opportunities through trading strategies.
However, the distinction is not absolute.
A quantitative investment firm can run short term systematic strategies, while a quantitative trading firm can manage portfolios and hold positions for longer periods.
The two overlap heavily. Some firms do both.
The interesting part?
Building a model that predicts prices is only one piece of the puzzle.
You still have to prove that the signal has an edge, account for trading costs, control risk, and determine whether the strategy can actually make money in live markets.
That is where the real work begins.
#QuantitativeFinance #QuantTrading #SystematicInvesting #AlgorithmicTrading #QuantResearch

📈 The Financial Markets is a Battlefield. Who Are You Really Trading Against?
When you look at a price chart, you see candles, price movements, support, resistance, and perhaps a few indicators.
But beneath every price movement, there is something much more interesting happening.
Different participants are entering the market with different objectives, information, strategies, time horizons, and risk constraints.
Some want to provide liquidity. Some want to hedge their exposure. Some are searching for mispriced assets. Others are trying to predict where prices will move next.
They are all in the same market, but they are not playing the same game.
Let's look at some of the major participants in financial markets. 👇
1. Market Makers 🏦
Their job is to provide liquidity by quoting prices at which they are willing to buy and sell.
They aim to earn the bid-ask spread while managing inventory risk, adverse selection, and changes in market conditions.
However, market making is not simply about buying low and selling high. A market maker can lose money if prices move against its inventory or if better-informed participants trade against its quotes.
2. High-Frequency Trading Firms ⚡
These firms use sophisticated algorithms, fast infrastructure, and detailed market data to operate at very short time horizons.
Some provide liquidity. Others exploit short-lived price discrepancies, react to order flow, or trade statistical relationships between instruments.
In these markets, execution speed, transaction costs, queue position, and infrastructure can significantly affect profitability.
But speed alone is not an edge. A fast system executing a poor strategy is still a poor strategy.
3. Quantitative Hedge Funds 📊
These firms use mathematical models, statistical methods, and systematic research to identify potential trading opportunities.
Their strategies may include statistical arbitrage, momentum, mean reversion, factor investing, volatility trading, and other approaches.
The objective is not simply to discover patterns in historical data. It is to find relationships that can survive out-of-sample testing, transaction costs, changing market conditions, and competition.
This is where research quality becomes extremely important.
4. Banks and Institutional Dealers 💱
Banks facilitate transactions for clients, make markets in certain instruments, manage financial exposures, and operate trading desks across FX, bonds, rates, equities, and derivatives.
Some trades arise from client demand rather than a directional view on the market.
Understanding this matters because a large order does not automatically mean that someone has a strong opinion about where prices are going. It could reflect a client's need to exchange currencies, hedge an exposure, or rebalance a portfolio.
5. Asset Managers and Pension Funds 🏢
These institutions manage capital for individuals, pension beneficiaries, and other investors.
Their decisions may be driven by long-term investment objectives, benchmark requirements, portfolio allocations, liquidity needs, and risk limits.
A pension fund rebalancing a large portfolio operates under very different constraints from an HFT firm trading a short-lived opportunity.
Their time horizons and execution needs can be completely different.
6. Hedgers 🛡️
Not everyone enters the market to generate trading profits.
An airline might hedge fuel costs. An exporter might hedge foreign exchange exposure. An agricultural producer might lock in a selling price.
For these participants, reducing uncertainty in their underlying business may be more important than maximizing returns on the hedge itself.
This is a crucial point: a trade can be rational for one participant without being designed to make a standalone trading profit.
7. Arbitrageurs 🔍
Arbitrageurs search for pricing inconsistencies between related assets, exchanges, or financial instruments.
For example, a quantitative researcher might investigate whether two historically related securities have diverged more than their relationship can reasonably explain.
However, an apparent discrepancy does not automatically represent a profitable opportunity.
Execution costs, financing, liquidity, model risk, and the possibility that the relationship has permanently changed must all be considered.
8. Retail Traders 👤
Retail traders range from discretionary traders making decisions from market information to automated strategies.
Some focus on technical analysis, others on macroeconomics, order flow, statistical models, or algorithmic execution.
The important distinction is not simply retail versus institutional.
It is the quality of the research, the cost of execution, the available infrastructure, the ability to manage risk, and whether the strategy has a genuine edge.
A retail trader can build a sound research process, but competing in certain markets, particularly latency-sensitive HFT, requires capabilities that are difficult and expensive to replicate.
🧠 So, what does all of this mean for a quantitative trader?
It means that understanding price movements is only one part of understanding the market.
You also need to think about the participants generating orders and the reasons behind those orders.
Who might be providing liquidity?
Who might be demanding it?
Could the flow be driven by hedging, portfolio rebalancing, news, or short-term speculation?
Are you observing a repeatable statistical relationship, or just a pattern that looks convincing on a chart?
And most importantly, can you turn that observation into a strategy that remains profitable after costs and realistic execution assumptions?
These questions can help you develop better research hypotheses around order flow, liquidity, market impact, price formation, and potential trading opportunities.
Of course, we cannot reliably infer every participant's identity or intention from price and order flow alone. These are hypotheses to investigate, not facts to assume.
The real objective is not to know who every trader is. It is to understand the incentives, constraints, and behaviours that may be shaping the market.
Because in quantitative trading, the goal is not just to predict prices.
It is to understand why a potential opportunity might exist, test whether it is real, and determine whether it can be captured consistently.
That is where market microstructure, statistics, mathematics, and systematic research come together. 🚀
Question: Which participant do you think has the most interesting role in financial markets: market makers, HFT firms, quantitative hedge funds, or institutional hedgers?
#QuantTrading #QuantFinance #AlgorithmicTrading #HFT #MarketMicrostructure

In the age of AI and LLMs, the real edge in quantitative trading is human. 🧠📈
AI can write trading algorithms, generate hypotheses, analyze market data, build predictive models, and automate entire research workflows.
But here's the real question: If everyone has access to the same AI tools, what gives one quant an edge over another?
Quantitative trading has a problem that AI alone cannot solve.
Finding patterns is easy. Finding patterns that actually make money is hard.
You can ask an LLM to generate hundreds of trading strategies. You can build models in minutes and produce impressive backtests.
But how many of those strategies will survive transaction costs, slippage, changing market conditions, and out-of-sample testing?
How many have discovered a genuine market inefficiency rather than simply learned to fit historical data?
Probably far fewer than you think.
This is where the human edge comes in.
📊 What to research: Identifying promising market inefficiencies and asking questions that lead to meaningful discoveries.
🧠 What to believe: Distinguishing genuine signals from noise, coincidence, and overfitting.
🔬 What to test : Designing experiments that challenge your hypotheses instead of simply confirming what you want to believe.
⚙️ What to build : Turning promising research into robust, executable trading systems that account for real-world constraints.
📈 When to adapt : Recognizing when a strategy has lost its edge, investigating why, and knowing when to move on.
Markets are competitive environments. An edge that exists today may disappear tomorrow because other participants discover it, market conditions change, or the original result was never statistically reliable.
AI can accelerate almost every stage of quantitative research.
But faster research doesn't automatically mean better research. Without sound judgment, AI can simply help you overfit faster, test bad hypotheses faster, and deploy flawed strategies faster.
As these tools become more accessible, the ability to combine mathematical intuition, statistical discipline, market understanding, and engineering becomes even more important.
The real advantage isn't just knowing how to use AI. It's knowing what to ask, what to investigate, what to reject, and what deserves further research.
The future of quantitative trading isn't humans versus AI. It's researchers who know how to use AI versus those who don't.
The tools are becoming more powerful.
The question is: Can you use them to discover an edge that the market hasn't already priced in? 🚀
#QuantitativeTrading #AI #QuantFinance
