

Analyst at #MakingDataCount @NHSEngland, creating SPC chart tools in SQL, Power BI, and Excel #PlotTheDots
- Tweets168
- Following645
- Followers283
- Likes526


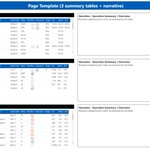




ALT The title at the top reads 'Page Template (3 summary tables + narrative). Below that are three summary tables on the left with text for narrative on the right for each of them.

ALT The title at the top reads 'Page Template (3 SPC charts with main chart and summary info + summary table + narrative). Below that is an SPC chart on the left with summary info relating to on its left. To the right of the SPC chart is a summary table with two smaller SPC charts underneath. At the bottom is a section for text and a table for additional narrative.

ALT The title at the top reads 'Page Template (20 SPC charts). Below that are 20 SPC charts in four rows and five columns.

ALT The title at the top reads 'Page Template (1 Pareto chart SPC charts). Below that is a Pareto chart, and below that are three SPC charts that relate to the first three columns in the Pareto chart.
ALT The title at the top reads 'Page Template (3 summary tables + narrative). Below that are three summary tables on the left with text for narrative on the right for each of them.
ALT The title at the top reads 'Page Template (3 SPC charts with main chart and summary info + summary table + narrative). Below that is an SPC chart on the left with summary info relating to on its left. To the right of the SPC chart is a summary table with two smaller SPC charts underneath. At the bottom is a section for text and a table for additional narrative.
ALT The title at the top reads 'Page Template (20 SPC charts). Below that are 20 SPC charts in four rows and five columns.
ALT The title at the top reads 'Page Template (1 Pareto chart SPC charts). Below that is a Pareto chart, and below that are three SPC charts that relate to the first three columns in the Pareto chart.