

Mekong Dam Monitor: Providing near-real-time monitoring of Mekong River Basin dams and their impact. By @StimsonCenter & @EyesonEarth2.
Joined December 2020
- Tweets1.4K
- Following525
- Followers2K
- Likes191






Pinned Tweet
See us at work in this @NBCNightlyNews story. #MightyMekong

WATCH: Critics are pointing to China for causing an environmental disaster along the Mekong River. @Keirsimmons speaks to some of those living and working along the river.
As we predicted in our last update, over the past two weeks the Mekong Floodpulse contracted from 18,500 square kilometers to 17,100 square kilometers of seasonal inundation. This is significant as we have observed for the last four years the floodpulse reduction beginning at the end of October or at the beginning of November. While reverse flow from the Mekong mainstream into the Tonle Sap was normal for the wet season--and much higher than recent years--low lake levels at the start of the wet season and a lack of rainfall over the lake throughout the season appear to be the main drivers of the early floodpulse peak. It is uncertain what the effect of the early peak will be. We do not think this is necessarily an indicator of a poor fish harvest for 2026 into 2027. Learn more at mekongmonitor.stimson.org. 1/3

1
3
463
Last week saw a small net restriction of water (430 million cubic meters) across the Mekong. Major dam restrictions were observed at Huangdeng (PRC, 201 million cubic meters), Xiaowan (PRC, 210 million cubic meters) and Nam Ngum 1 (LAO, 219 million cubic meters). 2/3

1
35
River Levels: Levels along the Mekong are much lower than normal for this time of the year. Chiang Saen, Thailand is already at low levels common to the dry season. Learn more at mekongmonitor.stimson.org. 3/3

23
China’s dam restrictions significantly reduced July flow in the Golden Triangle. During the month of July, Chinese dam operators withheld a large amount of water upstream of the Chiang Saeng gauge in the Golden Triangle. China’s reservoirs filled with more than 4 billion cubic meters of water in July, reducing flow to the Chiang Saeng gauge by 36%. Estimated natural flow at the Chiang Saen gauge would have been near the historical average of 12 billion cubic meters had this water not been withheld. Instead, observed flow totaled 8.15 billion cubic meters. Artificially low wet season flow is damaging to wetlands, fisheries, and farming practices in the Mekong. Throughout the rest of the lower Mekong, dams had much less impact. However, low rainfall over the lower basin led to lower than normal flow at Nakhon Phanom, Thailand and Stung Treng, Cambodia. Learn more at mekongmonitor.stimson.org. 1/4

1
3
203
Last week saw a significantly large net restriction of water of more than 4 billion cubic meters of water from major dams. The largest restrictions were observed at Xiaowan (PRC, 1.32 billion cubic meters), Nuozhadu (PRC, 1 billion cubic meters), Nam Ngum 1 (LAO, 1.4 billion cubic meters), Nam Ngiep 1 (LAO, 157 million cubic meters), Sirindhorn (THA, 207 million cubic meters). These large restrictions have a significant impact on reducing the power of the Mekong floodpulse which feeds tens of millions of people with fish and agriculture. 3/4

1
93
Levels along the Thai-Lao border are rapidly decreasing after nearly flooding last week. Levels in Cambodia continue to rise but are unlikely to hit flood level. Tonle Sap levels are still well below normal for this time of year. Learn more at mekongmonitor.stimson.org. 4/4

26
Recent rain throughout the Mekong lifted river levels and triggered the famous Tonle Sap reversal. Each year, the Tonle Sap expansion begins when the Mekong mainstream river level is higher than the river draining the Tonle Sap Lake. These conditions cause the Tonle Sap River to reverse flow and push water from the Mekong mainstream into the lake. The reversal is the key driver of the Mekong’s robust fisheries, making the Tonle Sap the largest inland fishery in the world. This year’s reversal started about six weeks late, and the current amount of reverse flow (4.03 billion cubic meters) is much less than the average for this time of year (11+ billion cubic meters). Upstream dams are now filling their reservoirs, effectively removing water and energy from the Mekong system that normally drives the reverse flow phenomenon. Last week alone, China’s large dams removed 2 billion cubic meters of water from the river when filling their reservoirs. Learn more at mekongmonitor.stimson.org. 1/4

Where’s the Water: Last week saw a significantly large net restriction of water (2.44 billion cubic meters of water) from major dams throughout the basin. Major restrictions were observed at Xiaowan (PRC, 596 million cubic meters), Nuozhadu (1.4 billion cubic meters), and the Sirindhorn Dam (THA, 185 million cubic meters). 3/4

1
39
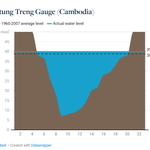
River Levels: Levels along the Thai-Lao border are about two meters below normal. River levels in Cambodia and Vietnam have returned to roughly normal levels for this time of the year. Learn more at mekongmonitor.stimson.org. 4/4

17
Mekong Dam Monitor Weekly Update for May 12-June 1:
Spotlight:
2026 Dry Season Flow Would Have Been Normal.
Dam releases from throughout the Mekong Basin prevented the Mekong from having a normal dry season flow pattern. From Chiang Saen, Thailand to Stung Treng Cambodia, the top of the blue bars show how monthly flow would have mostly matched the pre-dam flow conditions along the course of the Mekong for the entire dry season particularly for the critical months of March and April when the river should achieve its natural low point.
Instead, dam releases for hydropower production raised the river to unnaturally high levels. In March at Chiang Saen, dam release from China doubled natural flow—from February to May overall, these releases doubled natural flow. From March to May at Nakhon Phanom, dam releases from China and northern Laos nearly doubled natural flow.
These impacts carried through to Stung Treng, Cambodia where flow from March to May also doubled. Significantly higher water levels during the dry season are extremely harmful to local ecologies and natural resource provisions that rely on consistently low river levels during the dry season.
Image of the Week: Most of 2026 Dry Season Flow came from China.
The map shows that among the five sub-basins, China contributed 37% of dry season flow to Stung Treng, Cambodia from December 2025 through May 2026. Flow includes releases from dams and the natural flow of the river. This is slightly below average (38%) for the 2008-2026 time period when dams have significantly altered river flow. Prior to 2008, China contributed about 32% of flow to Stung Treng. Total dam releases for the dry season are estimated at 27.03 cubic kilometers. Natural flow for the dry season is estimated at 58.7 cubic kilometers— about 13% higher than pre-dam average flow of 51.3 cubic kilometers. Therefore, under natural conditions, the river would have been slightly higher than normal for the 2026 dry season, and dam releases raised the river by an additional 50%.
Where’s the Water: Last week saw a mix of releases and restrictions throughout the basin with a final net change of 300 million cubic meters of water added to the river system through dam releases. Nuozhadu (PRC) was the only dam to release a significant amount of water with 280 million cubic meters. This is the time of the year when dams begin to restrict flow and fill their reservoirs, so relatively low changes to the natural hydrological cycle are expected.
River Levels: Levels throughout the Mekong are between 1 and 1.5 meters higher than the long-term average mostly due to upstream dam releases still making their way through the basin.
Learn more at mekongmonitor.stimson.org.


This week the MDM team is launching a new feature: A monthly Stung Treng Flooded Forest Tracker that measures higher than average dry season flow at Stung Treng. Higher than average dry season flow kills trees and erodes islands in the protected Stung Treng Ramsar site. Dam releases upstream for hydropower generation artificially raise the level of the river – a phenomenon the MDM has tracked for years. This new tracker shows the reader the time period in which flow has been above and outside the long term average and provides a current snapshot of how much higher flow is compared to the long-term average. See the new tracker and learn more at mekongmonitor.stimson.org 1/5

1
3
125
Collectively, dams throughout the basin recorded high releases over the last two weeks, totaling an estimated 1.6 billion cubic meters. Major releases last week came from Xiaowan (PRC, 1.1 billion cubic meters), Nuozhadu (PRC, 148 million cubic meters), Nam Ngum 1 (LAO, 101 million cubic meters), and Theun Hinboun Expansion (171 million cubic meters). 4/5

1
2
40
River Levels: Levels throughout the Mekong are between 1 and 1.5 meters higher due to upstream dam releases . Points in the lower reaches of the Mekong are particularly higher than normal due to higher-than-normal dam releases from Laos. Learn more at mekongmonitor.stimson.org. 5/5

27
Between February 25 and March 23 China’s Xiaowan Dam, the 2nd largest in the basin, released almost 1.8 billion cubic meters of water for hydropower production. The comparative image shows the reservoir level dropping dramatically during this time. Throughout the entirety of the mainstream from Thailand to Vietnam, the releases caused river levels downstream to reach a near all-time high for this time of year. Artificially high river levels are dangerous for important ecological cycles in the Mekong. Learn more at mekongmonitor.stimson.org. 1/4

Collectively, dams throughout the basin recorded exceptionally high releases last week, totaling an estimated 2.1 billion cubic meters. Major releases last week came from Xiaowan (PRC, 758 million cubic meters), Nuozhadu (PRC, 314 million cubic meters), Nam Ngum 2 (LAO, 143 million cubic meters), Theun Hinboun Expansion (LAO, 212 million cubic meters), and Sirindhorn (THA, 101 million cubic meters). 3/4

1
81
River Levels: Levels throughout the lower Mekong are several meters higher than normal for this time of year. Many points along the Mekong are at an all-time high for the end of March. Learn more at mekongmonitor.stimson.org. 4/4
