

The platform for machine-learning powered advertising attribution.
Joined March 2021
- Tweets2.4K
- Following481
- Followers5.7K
- Likes1.8K


Last week's performance trends, according to our data.
As political spending moves around, so too does the chaos across ad platforms.
We are in the final week before spending spikes. Typically we see ad spend skyrocket on November 1 in preparation for Black Friday Cyber Monday.
But we also just had Prime Big Deal Days, so folks are recovering from that - wasted spend there caused the dramatic week over week improvements in performance on "All Other Platforms" which is about 30% Amazon.
Political spending is important, but not as much as you think. The @nytimes reports that of the billions spent, most falls in Texas, Ohio and Michigan.
Don't expect your CPMs to improve TOO much after election day.
What are you seeing in your data?

To get these charts in your inbox every Thursday, subscribe here: themediabuyer.northbeam.io/

Are you in NYC? 🗽
Come hang out with @BryanBumgardner and @mkobach for a casual but plugged-in dinner.
Every day these guys are talking to operators on the bleeding edge of commerce.
And they're ready to share what's working and what isn't.
Join them and Northbeam at the link!
luma.com/northbeam-o5iv


Northbeam retweeted

I get paid to yap about cool stuff I see looking at @northbeam data.
@theisaacmed am I making you proud
Northbeam retweeted
This team is doing numbers you can't even dream about.
And yet I don't hear anybody talking about them. So I will.

For the best operators, Black Friday started months ago.
If you're trying to catch up to them, here's this excellent pod by @M__Operators featuring @codyplof @couuor @MAustinHarrison
Full episode in the thread
Northbeam retweeted
I cannot believe this, but I analyzed the data for literally two weeks before posting this chart, and yes, this is true

New customer acquisition on Meta is getting cheaper, contrary to popular opinion.
When looking at average nCAC across all 1,000+ ad accounts tracked by Northbeam, we can clearly see that costs dropped by as much as 33% in Q3 year over year.
This is tracking billions in ad spend, filtered for accounts that only appear in both quarters, for a fair comparison.
How is this possible?
A few hypotheses:
1. Public opinion (especially on this platform) is quick to blame Meta. Anecdotal evidence is NOT indicative of an actual trend - you must bring data. This is kind of our whole thing at @northbeam.
2. Meta has made significant algorithmic changes this year, as we've seen in past charts shared on this channel. It seems like these changes are working. Or at least, people are adapting.
3. I do not expect this drop to continue forever. Although we have eschewed all seasonal trends here, CACs will increase during BFCM and stay elevated through Christmas.
4. Targeting new customers has gotten easier. Northbeam Apex and Meta's incremental attribution have improved new customer acquisition performance across our advertisers.
5. So it's not just prices - it's HOW we are targeting new customers. Because we're better at targeting, it's getting cheaper over time.
6. These attribution models only improve with time. Therefore, the downward trend seen below.
7. The huge spike is Amazon Prime Day + Father's Day + 4th of July, which were awkwardly placed near each other this year.
8. Meta remains undefeated. We had some growing pains there, but this chart clearly shows that on average, new customer acquisition is improving, at least across Northbeam advertisers.
9. Everyone is listening to people like @9operators when they hammer new customer acquisition as a key priority for your business, and therefore folks are getting better at it.
10. Something happened this summer. Some kind of cultural vibe shift mixed with macro changes. Folks are just... happier? And happier people buy more stuff. You probably feel it too.
11. Macroeconomic challenges around gas prices, shipping disruptions, and exchange rates have culled a generation of DTC businesses, which has decreased competition somewhat. Lots of businesses folding this year.
12. Meta is actually listening to us and building a platform that permits us to efficiently and cheaply target new customer acquisition. Granted, they are still pushing AI that will make many of the people reading this message redundant.
13. The loudest folks online are the ones having problems with Meta Ads. I know many killers on here who don't ever speak to their own performance and are doing great right now. As a wise man once said:
"The realest ecomm operators move in silence like the 'g' in lasagna."
What are you seeing in your data?
All charts and analysis by @BryanBumgardner 🛰️
This is it. This is the BFCM podcast you must watch.

Black Friday moves fast.
Daily targets aren’t enough.
Here’s what + how to track …
1️⃣ Hourly Revenue vs Last Year
2️⃣ Daily MER: Before & During
3️⃣ Accrual ROAS vs Cash ROAS
4️⃣ 1-Hour, 1-Day Click Accrual
5️⃣ Percentage of New Visitors
6️⃣ Clicks + Deterministic Views
@MAustinHarrison + Andrew Kaszuba from @northbeam unpack Black Friday budget calls w/ @couuor + @codyplof
“Marginal incremental spend might have not been a great idea.”
There is a method for Black Friday madness.
In our humble opinion, the guys on @M__Operators have cracked it.
@MAustinHarrison joins the guys in breaking down exactly what you need to look at this BFCM.
Full episode in the thread:
This is the definitive guide on how to use Northbeam on Black Friday Cyber Monday.
If you want to scale like the best, you need to watch this👇
Thanks to our friends @M__Operators, @9operators, @couuor and @codyplof for hosting @MAustinHarrison and Andrew!
youtube.com/watch?v=7pyDLph7…
Northbeam retweeted

Black Friday moves fast.
Daily targets aren’t enough.
Here’s what + how to track …
1️⃣ Hourly Revenue vs Last Year
2️⃣ Daily MER: Before & During
3️⃣ Accrual ROAS vs Cash ROAS
4️⃣ 1-Hour, 1-Day Click Accrual
5️⃣ Percentage of New Visitors
6️⃣ Clicks + Deterministic Views
@MAustinHarrison + Andrew Kaszuba from @northbeam unpack Black Friday budget calls w/ @couuor + @codyplof
“Marginal incremental spend might have not been a great idea.”
Northbeam retweeted

Me and @BryanBumgardner are hosting a Media Buyer dinner in NYC on Nov 4th.
Great brands. Thoughtful conversations. Free to attend, but you need to apply here: luma.com/northbeam-o5iv
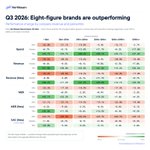
Q3 2026 highlighted the gulf between "winning" and "losing" advertisers.
We looked in our data and compared spend, revenue, etc. across annual revenue categories of businesses we work with.
Then we compared performance in Q3 2025 vs Q3 2026.
The percentiles demonstrate the spread in performance across all 1000+ ad accounts we track. Billions in ad spend.
What we can see:
Obviously, smaller revenue brands are more volatile. They have a wider percentile spread because they're less established.
But what's even more interesting is the massive positive growth in high percentiles in the middle of this chart.
Are eight-figure brands outperforming because they have more headroom to grow? Because they haven't fully saturated their market?
Or are they simply more nimble than their larger and smaller counterparts? Or do they know something about growth the rest of us don't?
How to use this chart:
1. Calculate your year over year performance in Q3 for each metric.
2. Identify which column you fall into, based on annual revenue.
3. See what percentile you fall into. If you're 75th and up, you're doing great. Below 50% means more than 50% of your peers are doing better than you.
All charts and analysis by @bryanbumgardner 🛰️
