

The only infinitely scalable, instantly deployable, privacy-first occupancy monitoring solution.
Joined October 2020
- Tweets621
- Following91
- Followers65
- Likes45





We measured 50 million square feet of office space. Here’s what we found.
The H1 2026 Space Utilization Index is out: sensor-measured occupancy across corporate office portfolios, February through June.
📉 RTO policies aren’t having the desired effect.
People are coming in, but not at the rates many plans assume. Weekly peak utilization has plateaued at 52.3% — at the busiest moment of the week, the average office is just over half full.
📅 The office week has a three-day core.
Mondays now look more like Fridays, with average daily peaks of 23% and 19% respectively. Tuesday is the busiest day at 42%, making it the critical day for space planning and operations.
🪑 Space isn’t always used as intended. Conference rooms sit empty 3.75 hours a day on average. When they are in use, 78% of that time holds two people or fewer, including rooms built for 7 or more. They’re doubling as private offices, while open collaboration areas remain underused.
👥 People come in for people.
Nobody drives 30 minutes to take a Zoom call they could take more comfortably at home. Dining and gathering spaces reach 56% average daily peak utilization, compared with 35% for open workspaces and 21% for the open collaboration areas companies keep adding.
Today's offices are operating differently than what they were designed for. Yet many are still being planned, staffed and operated as though the old patterns apply.
Missed it live? Watch the full conversation with Melissa Michalik of JLL here: hubs.la/Q04CHVZh0
Get the H1 2026 Space Utilization Index behind the discussion, with measured occupancy from 50M+ sq ft: hubs.la/Q04CHVYJ0
#SpaceUtilization #OccupancyIntelligence #CorporateRealEstate #WorkplaceStrategy #Occuspace


We’re in Chicago this week for @CoreNet Global's Summit, and the same issues keep coming up: RTO policy, site consolidation, office allocations, share ratios, renovation plans, and where AI actually fits into any of it.
Every one of those decisions rests on a single question. How is the space actually being used?
Most teams answer it with badge swipes and room bookings. A swipe proves someone entered the building. A booking proves someone reserved a room. Neither proves the space got used, when, or for how long.
@MelissaMichalik LEED AP,CFM, Global OPM Operations Leader at @JLL, put it plainly on our recent webinar:
“Badge data doesn’t track when people leave the space. It tracks when people come in. So if you’re using badge data solely to understand your utilization, you stand to make some big errors.”
She and @EnidMaran, our Head of Customer Success, got into what that gap costs you when you’re planning a portfolio. Clip below.
If you’re here, come find us at Booth 123. Bring a floor plan and a question about it.
This year's CoreNet Global Summit theme is "From Complexity to Clarity." For most CRE leaders, that's a pretty good description of the job.
Hybrid schedules, consolidation decisions, budgets that want proof before anything moves. The complexity is constant. Clarity usually starts with one plain question:
How is your space actually being used?
Nic, Linus and Alex are at Booth 123 in Chicago, October 26–28. If there's a portfolio call you're making on gut feel right now, stop by or send a note to set up time.
Stop Guessing. Start Knowing.
#CNGSummit #CNG26Chicago

Let us pause now for a moment of science. 🔬
@ElizabethAshley from our team was recently on the @VirginiaTech campus, helping get Virginia Tech's College of Science set up for Society for College and University Planning (@SCUP)'s national space utilization study. We're proud to support the university's participation.
We also spotted a football-themed prize wheel in the building. The wheel is a mystery. How their space is being used won't be.
Thanks for having us, Hokies!


In Chicago early for Summit week? Come watch Sunday Night Football with us.
The night before @CoreNet Global Summit opens, the #Occuspace team is hosting a watch party at Fatpour Tap Works – McCormick, a short walk from McCormick Place. Chiefs at Seahawks on the big screens, food and drinks on us, and a few games of our own, including one where our sensor keeps score of how full the room gets.
Come for the game, stay for the conversation with people who think about space the way you do.
Sunday, October 25
Doors 6:30 PM CT, kickoff 7:20
Hosted by Nic, Linus and Alex
Spots are limited, so save yours link in the comments.
See you in Chicago.


Join us today @ 12 PM ET: live on @Bisnow with JLL!
On its busiest day, the average office peak is just 52.3% full. Mondays now look like Fridays. Conference rooms mostly hold one or two people.
We'll walk through the H1 2026 Space Utilization Index (actual measured occupancy, not badge swipes, across 50M+ sq ft) with @MelissaMichalik of @JLL, and what it means for your next lease, layout and budget.
Free to join. Every registrant gets the full report.
Link to register in the comments.


Tomorrow: Don't Miss!!
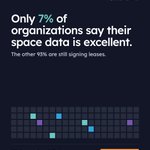
Only 7% of organizations rate their own space data as excellent, according to JLL.
The other 93% are still making lease, capital and consolidation decisions with it.
This Wednesday at noon ET, Melissa Michalik of JLL joins Nic Halverson, Linus Grasel and Enid Maran to break down the 2026 Corporate Space Utilization Benchmark: real occupancy data from more than 50 million sq ft and 10,000+ corporate workspaces.
What we’re getting into:
→ Where portfolios are quietly carrying excess capacity
→ How peak-day patterns distort decisions for the other four days
→ What badge swipes and room reservations structurally can’t tell you
Every attendee gets the full benchmark to pressure-test their own portfolio.
Wed, Oct 21 · 12:00 PM ET · Hosted by Bisnow

Even on Tuesday, more than half the office sits empty.
That’s from our Spring 2026 data. At the single busiest moment of the week, the average corporate office was 52% occupied. On Mondays and Fridays, the daily peak sits around 20%.
Issue 02 of #DwellTime, our monthly newsletter on how buildings get measured, understood, and managed, looks at what that gap costs:
→ The Numbers: the shape of the work week in corporate and campus offices
→ From the Field: an insurer measured 23 offices, found 14 averaging under 15%, and now saves $3.5M a year
→ The Shift: @NicHalverson on paying for a five-day office in a three-day week
→ Worth Reading: @IFMA, @SchneiderElectric, @InsideHigherEd, and @BOMA International
One question for you: does your organization have a return-to-office mandate? Tell us in the comments. We’ll share what we hear, alongside our data, in Issue 03.
Read Issue 02 and subscribe: hubs.la/Q04Bh-nP0

You pay for 100% of your office. On its busiest day, 52.3% of it gets used. That’s the average weekly peak from February to June 2026, measured in our 1H 2026 CRE #SpaceUtilizationIndex. The empty half still costs rent, power, cleaning and upkeep, every day.
An average won’t tell you what to do about it. Consolidating a floor, resizing a site or renegotiating a renewal all depend on knowing where the empty space sits, when and for how long.
Join us for the full picture: “The State of Office Space Utilization and Optimization,” a free @Bisnow webinar with #Occuspace and @JLL Wednesday, October 21, 12 PM ET. Live and online.
@MelissaMichalik LEED AP,CFM of #JLL joins @NicHalverson, @elgrasel and @EnidMaran of #Occuspace to walk through measured occupancy from 50M+ square feet and 10,000+ corporate workspaces, and what it means for your portfolio.
Every registrant receives the full report and the recording.
Register free: hubs.la/Q04B98jC0

Last week at @WORKTECH New York, @NicHalverson gave the room a first look at the CRE Space Utilization Index 2026.
Five minutes, one key finding: average weekly peak utilization stands at 52%.
On October 21, we’re walking through the full index live with @JLL, including what that number means for portfolio decisions. If we met in New York, this is where the conversation continues.

Another campus, another thumbs up from @AndyMoore, our Director of Implementation.
He's being on the road for a while now deploying for the @SCUP National Research Study, helping universities see how their space actually gets used. Not what the room schedule says. What really happens.
This stop: @UniversityofCaliforniaDavis. Mrak Hall was a gracious host. (The Eggheads out front were a tougher crowd.)
Curious about the study, or what it could show on your own campus? The link is in the comments. Want to talk space data? DM us. We'd love to connect.

