






Pinned Tweet
We often get asked about why we are called One2N well, here’s @chinmay185 & @jdk2588 sharing the story.
Our mission: help you go from 1 to N, wherever you need scale. Watch the video to hear it straight from the founders!
A fintech cut its analytics bill from $13,000 to $4,000 a month: AWS Glue and Athena to self-hosted ClickHouse, one layer at a time. p95 query latency 4.2 s, on par with Athena.
When you leave managed services, you own the monitoring. OpenTelemetry and Last9 went in on day one.
one2n.io/case-studies/migrat…

Part 5 of 5 - Understanding relevancy scores, and why histogram basics still matter
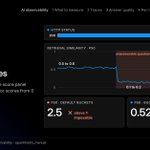
In part 1 we asked: did the bot pull documents that fit the question? A relevancy score answers that. When the bot searches its documents, each match gets a similarity score from 0 to 1. Higher is closer to the question.

So you record the score as a histogram and watch its p50. Here an old lesson returns. The previous histogram quiz: the default OpenTelemetry buckets are made for milliseconds - 0, 5, 10, 25.
Every score lands in the first bucket, and the p50 comes out as 2.5. A score can never be above 1.
With explicit buckets 0.1 wide, the p50 was 0.52.
The trade-off: every bucket is one more time series for each label combination. Choose boundaries for the range you alert on, not the widest range you can think of.
#AIObservability #OpenTelemetry #SRE
Why an average hides your slowest users:
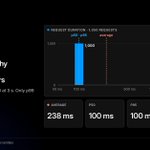
1,050 requests: 1,000 at 100 ms, 50 at 3 s.
• Average: 238 ms (no request took 238 ms)
• p50: 100 ms
• p95: 100 ms
• p99: 3 s
pN drops the slowest (100-N)%. The slow tail is 4.8%, just under p95's 5% cutoff, so p95 steps over it and reads 100 ms. p99 drops only 1%, so the 3 s surfaces.

Rule: a percentile only sees a tail bigger than its cutoff. Pick one whose cutoff is under the share of users you care about. Slowest 2%? Use p99, not p95.
LLM tails are wider (50 vs 2,000 tokens, 1 vs 4 agent turns), so this bites harder. And a percentile is only as good as its histogram buckets: ms-scale buckets reported p50 2.5 on scores that never exceed 1.

Worked example (illustrative numbers). Same question put to two models:
> Model A: $0.00027 per call, answers in 1 call. Cost per good answer: $0.00027.
> Model B: $0.00018 per call (cheaper), but takes 3.4 calls and passes only 80% of the time.
- 3.4 calls x $0.00018 = $0.000612 per attempt
- 1 in 5 attempts fails, so divide by 0.8: $0.000612 / 0.8 = $0.000765 per good answer
Result?
Model B costs $0.000765 vs Model A's $0.00027 per good answer. Almost 3x more, even though each call is cheaper.
So track cost per conversation and per good answer, not per call.
Next: relevancy scores, and why histogram basics still matter.
#AIObservability #OpenTelemetry #SRE
Dropping an interesting old blog of ours where an ML service answered in under 2 seconds. Its users waited more than 20s for the response increasing the tail latency.
LLM systems have the same shape. Put a span or a metric on each step, both directions.
Read our article here by @chinmay185
one2n.io/pragmatic-software-…

Part 3 of 5 - Understanding how to measure answer quality
In part 2 we saw how one can use standard model attributes provided by OpenLLMetry / OpenLIT libraries and inject their custom business attributes and get insights into the performance and cost of LLM calls.
But when it comes to correctness, AI applications deviate from our standard practices.

Tracing and cost tell you if the agent is slow or expensive. Quality needs a different set of features:
• Scores - human thumbs up/down on an answer. The only signal that fires when the agent answers badly without erroring.
• LLM-as-a-judge - auto-scores new traces as they arrive, no human in the loop.
• Datasets and experiments - run a fixed question set on the old model, swap, diff the scores before you roll out.
• Prompt versioning - every trace records its prompt version, so you can pin a quality drop to a specific edit.
• Sessions - replays a full conversation, because "was the user happy at the end" is not a single-answer judgment.
Evals are just the offline loop. The other features run on live production traffic - and that is where plain metrics and traces tell you nothing about whether the answers are any good.
Next: per-turn metrics, and when a cheaper model costs more.
#AIObservability #OpenTelemetry #SRE
Understanding histogram buckets: a quiz
A RAG bot gives each document it finds a similarity score between 0 and 1.
We recorded five scores in an OpenTelemetry histogram with the default buckets: 0.574, 0.514, 0.513, 0.447 and 0.308.
A histogram does not keep each value. It only counts how many values fall in each bucket: 0 to 5, 5 to 10, 10 to 25, and so on.
What p50 did histogram_quantile report? Vote in the poll. The answer is in the comments tomorrow.
#Observability #OpenTelemetry #Prometheus

Part 2 of 5 - Understanding traces for LLM requests
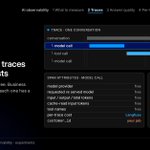
Observing AI applications relies on the same telemetry signals as everything else - metrics, logs and traces. This post looks at what a useful AI trace is made of: which span attributes you get for free from standard libraries, and which ones you still have to work for.

You can inject as many custom attributes as you can imagine, but there is a trade-off: more attributes mean more dimensions to slice on, at the cost of storage and query speed.
A customer_id for an early-stage company is cheap - 10s to 100s of values. Something as fine-grained as user_id can cause a cardinality explosion and slow down trace search.
None of this is specific to AI. The signals are the ones we have always had, and the cardinality trade-off is a decades-old observability lesson, not a new AI one. Do not go hunting for a brand new way to do AI observability - approach it from first principles and AI becomes just another workload you instrument well.
The shift comes when you measure the non-deterministic parts of your agent - answer quality, or time-to-answer weighed against cost. We will look at those in the next post.
#AIObservability #OpenTelemetry #SRE
Check out our open source repository - github.com/one2nc/ai_observa…
star it as we're going to be publishing a lot more around it!
