

Performance engineer @ Adapative, ex-Scylla, ex-Hazelcast.
Joined October 2013
- Tweets2.3K
- Following196
- Followers2.4K
- Likes2K






If you can't get used to the New UI from Jetbrains, but the classic UI looks bad because all the padding around the text is gone, use this setting: -Dide.ui.scale=1.6
I have been working on Aeron support for the new async-profiler span API. Below are 2 screenshots; one where spans are ignored and one where the spans help to identify causes of latency outliers. The load is created by a showcase app causing problems intentionally.


Finding the source of latency outliers can be pretty difficult. For Adaptive have been working on an eBPF based tool that injects probes at the appropriate location to track things like context switches, irqs, page faults, safepoints, ipi's/tlb-shootdowns etc.

On from the cmd line you can specify what you want to monitor e.g. -e page-fault:major -e ctx-switch --cpus 16,18,20 --pid driver --tid sender --threshold 10us. It really allows you to drill down.
So you can do top, record, report etc. You can also create hdrhistogram files. Stack traces can also be captured. Currently it is still closed source, but I hope we can make it open source at some point in the future.

Peter Veentjer retweeted

/goal implement a new database in C++. Similar to DuckDB, but faster in the Clickbench benchmark.
[... pursuing the goal...]
a few days later: github.com/ClickHouse/ClickB…

Claude Code is an amazing tool, but it isn't particularly strong with memory ordering. I needed to point out all kinds of mistakes in its reasoning to keep it on track.
Ubuntu HWE (Hardware Enablement) is a big turd: you think you're on a stable Ubuntu release, but you're silently getting the latest kernels. Bad news if you care about a stable environment or reproducible performance.
TIL: if you have isolated cores (isolcpus) and use numactl --cpunodebind without specifying --physcpubind, then the affinity mask of the created threads includes the isolated cores!
Looking at a single histogram is useful to get an overall impression of latency behavior.
But interval histograms (for example, one every second) are far more useful because they reveal how latency evolves over time.
Luckily, HdrHistogram provides built-in support for this.
I find AI quite useful for exploratory redesign. It is quite easy to change large sections of code and see the outcome of the redesign and figure out the roadblocks. And when actually doing the redesign, I can peek at the experimental branch.
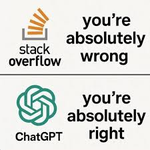
For deep down OS and CPU-related design and debugging sessions, I find Claude significantly better than ChatGPT. It shows a much better understanding and a much lower false cause rate. The primary advantage of ChatGPT is lower limits.
I finally have the kernel up and running using virtual memory. I tried segmentation based 'virtual addresses' first, but that was a never-ending disaster, so I decided to take the leap and switch to proper paging.