

Property data API + MCP for investors, proptech devs & AI agents: owners, LLC portfolios, sales, permits, risk. Free tier, no card. https://nitter.cf/t.co/jbzYRE4AdB
United States
Joined April 2026
- Tweets249
- Following170
- Followers19
- Likes208







PropRaven retweeted

Day 9 of #30DayMapChallenge — Urban-rural.
There’s an 11-acre working farm in the middle of a Gilbert, Arizona suburb.
We mapped the years 2,857 homes went up around it. The farm is still growing food.
Built in Unmapped. Map + story below.
PropRaven retweeted

Thousands of NYC datasets are open to the public. Learn how to actually use them. 📊
Join us for Discovering NYC Open Data, a free, beginner-friendly class.
📅 Nov 16, 6:00–7:30 pm ET
🔗 beta.nyc/event/e261116

ALT Flyer for “Discovering NYC Open Data,” a free recurring online workshop from NYC Open Data Ambassadors and BetaNYC. Text highlights learning how to find, filter, and visualize NYC data, with a QR code, an illustration of two people holding charts, and partner logos at the bottom.
PropRaven retweeted

SpaceX has been quietly assembling a pretty big footprint near the Port of Brownsville.
Based on Cameron County deed records, they’ve picked up roughly 2,000 acres in the area. I plotted all the 2026 parcels on one map.
The 444-acre tract is the one to watch. They’re building datacenter. Phase 1 is about 750 MW. A City of Starbase hearing notice from Nov 6 put the estimated capital investment for the initial phases at around $24 billion. Given the size of the site and how dense these facilities can get, it would ends up in the 1.5–2 GW range.
They’ve also got two natural gas pipelines approved to cross the channel. The 79-acre strip is only about 63 meters wide, the kind of shape you’d expect for a temporary pipeline corridor.
The rest of the parcels are long and narrow, and there’s no official use stated yet. But SpaceX has said they want about 13 GW of compute online by the end of 2027. These tracts look like they’re set up for more of the same.
Mapped from Cameron County deeds and public records.

PropRaven retweeted

RustGIS v0.6.0 is here!
RustGIS is a fast, free and open-source GIS in pure Rust for mapping, analyzing and sharing geospatial data. It runs natively on Windows, macOS and Linux, and in your web browser. Your data stays on your machine unless you send it to an AI model you choose, and every action is a command you can script.
This release runs your tools in the background with progress and Cancel, exports layouts as vector PDF and SVG, and adds diagrams, label callouts and new polygon editing tools. It brings together more than 250 pull requests from 29 contributors, 8 of them contributing for the first time. Thank you to everyone who helped!
What's new in v0.6.0
- Background work: tools, exports and large reads run off the main thread with progress and Cancel, many on several cores, plus batch runs.
- Publication output: layouts as vector PDF and SVG, multi-column legends, and maps exported as georeferenced GeoTIFFs.
- Cartography: pie and bar diagrams, label callouts, Move Label, and MapLibre hillshade and colour relief.
- Editing: Cut Polygon, Reshape and Trace, with Check Geometry and Repair Geometry to fix invalid shapes.
- More data: CityJSON city models, ArcGIS protocol buffer pages and cloud-optimised GeoTIFFs read in place.
- Workspace: a History pane of tool runs, custom themes, UTM and MGRS readouts, and Greek and Lao.
Try it out
- Launch the web app: web.rustgis.app
- Download: downloads.rustgis.app
- Documentation: rustgis.app
- GitHub: github.com/opengeos/RustGIS
- Release notes: github.com/opengeos/RustGIS/…
#GIS #Rust #OpenSource #Geospatial #Cartography #RustGIS
PropRaven retweeted

𝐃𝐚𝐲 𝟔 - 𝐕𝐢𝐧𝐭𝐚𝐠𝐞 | #30DayMapChallenge
Nearly one in four Manhattan lots with a recorded construction year dates from before 1900.
For this map I rebuilt Manhattan in 3D from the city's MapPLUTO data: 40,037 lots, each raised by its number of floors and switched on in the year it was built, from 1800 to 2025. The island fills in slowly, then in waves, until the towers of Midtown and Lower Manhattan rise out of a sea of older, lower blocks.
One honest caveat: PLUTO's construction years are estimates, and the sudden jumps around 1900, 1910 and 1920 are mostly rounding in the records.
𝟐𝟎𝟐𝟓 𝐭𝐮𝐭𝐨𝐫𝐢𝐚𝐥 𝐨𝐧 𝐘𝐨𝐮𝐓𝐮𝐛𝐞: youtu.be/Pegd_mb28mY
𝟐𝟎𝟐𝟓 𝐜𝐨𝐝𝐞 𝐨𝐧 𝐒𝐮𝐛𝐬𝐭𝐚𝐜𝐤: open.substack.com/pub/milanj…
𝐓𝐡𝐞 𝐍𝐞𝐰 𝐒𝐜𝐢𝐞𝐧𝐜𝐞 𝐨𝐟 𝐌𝐚𝐩𝐬 - thenewscienceofmaps.com/
Data: NYC Department of City Planning, MapPLUTO 26v2; NYC Open Data building footprints.
#30DayMapChallenge #Python #NYC #UrbanPlanning #maps #dataviz
PropRaven retweeted

@BetaNYC just released a free connector (an MCP server) that tracks 140 public data sources across New York State: state agencies, counties, cities, New York City and its agencies, universities, and nonprofits. BTW, it works really well with the socrata MCP.
With this MCP, you can ask your 'assistant' -- "Do any New York cities publish zoning data? If so, what formats do they publish them in?" and it can tell you which portal has it, formats, and what the formats mean.
Second query to try — "Which New York cities publish housing code violation data? Search for 'housing code violations' and 'code enforcement', and list the results by city."
Simply, it points you to the data; it does not download it for you. It is open source (MIT) and needs no API key. PRs and feature requests are welcome.
With Node.js installed, add it to Claude, Cursor, VS Code or most other MCP clients with npx -y @betanyc/ny-data-registry-mcp.
Code and setup: github.com/BetaNYC/ny-data-r…
Browse the directory without AI: betanyc.github.io/grounding-…

PropRaven retweeted

MapLibre Navara - a highly extensible 3D map engine. Load a wide range of GIS data, from satellite imagery and terrain to 3D city models and vector data, then freely layer your own visualizations on top. Powered by Rust / WebAssembly. github.com/maplibre/navara

PropRaven retweeted

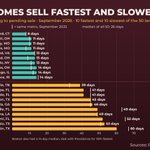
HousingWire Data reveals how shifting inventory, buyer activity and price reductions can help agents guide local buying and selling decisions:
housingwire.com/articles/loc…

PropRaven retweeted

Apartment construction starts are already down 50% from peak, and I'm increasingly of the view that they'll decline further here in Q4 and into 2027.
Just a brutal environment for apartment developers these days with high interest rates, frozen equity capital and some construction cost increases -- outweighing improved occupancy/rent trends in most cases.
No one is immune to math.
If you are relying on Census building permits for multifamily construction trends, you are blissfully unaware of realities on the ground.
PropRaven retweeted

Building opportunities start with the right information!🏗️🗺️
The City of Victoria’s interactive GIS map has been updated with new 2026 aerial imagery, updated topography lines and helpful details about properties and infrastructure throughout Victoria: victoriatx.gov/m/NewsFlash/h…

ALT Map of Victoria County with Victoria city limits and major roadways marked

ALT Map with close up view of border between Council districts 2 and 4. Neighborhood streets are visible
PropRaven retweeted

San Francisco tapped OpenGov to modernize its permitting system — and 10 of the most common permit types are now live, covering about 75% of annual building permits issued in the city. bizjournals.com/sanfrancisco…
PropRaven retweeted

Invitation Homes: We’re watching for shadow ‘accidental landlord’ supply
Invitation Homes, one of the nation’s largest single-family rental landlords with 85,961 wholly owned homes, says the rental supply picture recently is improving in some markets that have been hardest hit by the multiple year post-Pandemic Housing Boom cyclical cooling window. But on its Q3 2026 earnings call on Thursday, management flagged a wild card it’s keeping an eye on: “shadow [SFR] supply.”
My latest for @ResiClub_HQ: resiclubanalytics.com/p/invi…

PropRaven retweeted

The Allen County GIS Department redesigned the iMap homepage & the map viewers. Pages are also now mobile-friendly.
Explore the new interactive maps and GIS applications at acimap.us/
Read the full press release at allencounty.in.gov/m/newsfla…

PropRaven retweeted
Deeper dive on ULI's top picks (and bottom picks) for "markets to watch" in 2027 -- including some thoughts on what markets may be overrated or underrated for multifamily and BTR.
jayparsons.beehiiv.com/p/scr…


Here are the top 20 markets for real estate investment in 2027, according to ULI's annual Emerging Trends Report just released this week. Quick thoughts on multifamily market in each:
DFW stays No. 1, not a surprise. Been steadier than other Sun Belt markets. Still supply to work through, but still attractive and very liquid.
San Francisco ranks No. 5, up 40 spots from last year, and would probably rank No. 1 if not for the fact that many survey respondents would probably never invest in San Francisco regardless how it is. Same for Manhattan, where policy risk questions dampen some enthusiasm and redirect capital elsewhere.
Interesting to see DC's Northern Virginia suburbs rank high, yet its Maryland suburbs rank dead last and the District is in the bottom 5. But that's the reality of the DMV, and its just governance issues-- with the District and Montgomery County competing for the crown of most conspiratorial anti-business market while Northern Virginia gladly benefits from it.
Austin and Boise both rank outside the top 20, but I'd be bet on both being in top 20 next year. ULI's list is supposed to be forward-looking, but this is example of how in reality it's still very much a present-day lens... just like San Francisco ranking No. 45 last year.
Knoxville ranks as highest tertiary market, coming in at No. 20 overall. Good market but surprised it's so high.
ULI's survey respondents put Norfolk and Milwaukee in the bottom 10, but I think they're just saying they don't know these markets. Both are very steady and interesting, low supply.

PropRaven retweeted
Seattle reported intake review time cut by about 50%; Honolulu permit decisions averaged 32.5 days versus 73 days:
housingwire.com/articles/ai-…

PropRaven retweeted

$1,380 a month.
That’s what the typical homeowner pays for maintenance, property taxes and insurance, on top of the mortgage. New research from Zillow and Thumbtack finds the annual total is $16,566, up nearly 32% in five years.
Insurance is the fastest-rising cost. In Houston, Phoenix, Denver and Nashville, homeowners now pay more for it than for property taxes.
The pace is cooling, with costs up just 3% this year. But for buyers, these bills are a second affordability hurdle worth planning for before making an offer.
At Zillow, we believe in transparency, and that means showing the full picture of what it takes to own a home, not just the listing price. The more buyers know up front, the more confident their decision can be.

PropRaven retweeted
Case-Shiller rose 2.1% YoY in August, while September new home sales ran 676,000, with builder buydowns still shaping demand:
housingwire.com/articles/cas…

PropRaven retweeted

How can communities make #housing data easier to understand?
See how Bloomington, IN, is using #ArcGIS to bring housing, #zoning, #permitting, & development data together to support more informed #planning conversations
#GIS #Esri #GPN #govtech #smartcity nitter.cf/EsriSLGov/status/21135…

Do you need to understand housing availability in your community? What if you could track where housing development is happening in a simple map? The City of Bloomington, Indiana, did just that in their Housing Explorer. Read about it here: bit.ly/4yBxrwg
PropRaven retweeted
Zoning rewrite allows homes on any lot meeting yard rules, hundreds of city held parcels now qualify:
housingwire.com/articles/akr…

PropRaven retweeted
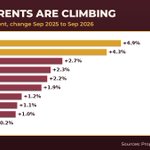
Rate hikes are intended to cool demand. But in U.S. rental housing, rates are cooling supply -- not demand.
Apartment absorption is on track for the third-hottest year in modern history, and rent growth (while still modest) has climbed up to a 3-year high, and could keep going with less supply on the horizon.
Does that mean rent inflation is about to re-accelerate? Not necessarily. But it's a plausible scenario that isn't getting the attention it probably warrants, given that rents are the single-largest variable in the CPI.
Reminder that most of us think about housing inflation in terms of home prices. But home prices have zero role in the CPI, where a survey of ~6k rental units per month (with a success rate <50%) is designed to estimate housing inflation for the two-thirds of Americans who own their homes.
