

Financial Markets, Algorithmic Trading, Portfolio management, Pinescript, Ninjascript,MQL4.
Joined April 2022
- Tweets3.8K
- Following974
- Followers265
- Likes3.6K




QuantGlobal retweeted

12 Mean Reversion Trading Strategies With Backtested Rules and Results
Mean reversion trading strategies look for a rebound after a market moves far enough in one direction. The backtests below use different ways to define that stretch, including oversold RSI, a jump in the VIX, a run of lower closes and a close near the bottom of the day’s range.
Each setup includes an explanation, historical results and its equity curve. The numbered trading rules are at the bottom. The tests use different dates, costs and position sizes. Compare the rules and the shape of the equity curves before comparing the headline numbers.
1. SPY RSI with a previous-high exit
This is a simple S&P 500 mean-reversion setup. It buys an oversold reading and exits after a rebound above the previous day’s high.
Historical results 388 trades, 77% winners, 0.8% average gain, a 2.6 profit factor, 9.1% CAGR, and a 23% maximum drawdown. Reported market exposure was 16%, with the test reinvesting all equity in each new trade.
The original write-up also tested entering at the next open while keeping the close-based exit. Average gain fell to 0.6% and CAGR to 6.5%. That comparison shows why we must keep the original execution assumptions attached to the results. The exact test endpoint and cost treatment need to be confirmed before making a like-for-like comparison with other systems.
Moving the entry to the next open lowered the average gain from 0.8% to 0.6% in the original comparison. A close-entry test captures the overnight move, so that difference matters when deciding which fill to model.
2. Triple RSI on SPY
Triple RSI waits for several days of weakening momentum within a longer-term uptrend. “Triple” refers to the sequence of conditions, not three unrelated indicators.
Historical results the original write-up reports 103 trades since 1993, a 90% win rate, a 1.2% average gain per trade, and a profit factor of 4. The precise test endpoint and transaction-cost assumption are not stated in the accompanying text.
The small trade count is part of the strategy’s character. It waits for a specific pullback rather than producing a daily signal. A 90% historical win rate does not mean future losses will be small or rare.
The sequence of weakening readings makes this a selective version of an RSI pullback. The 90% win rate came from 103 trades, and a few additional losses would materially change that percentage.
3. SPY RSI pullback with two moving averages
This version combines a longer-term trend filter with a short-term price filter. RSI must confirm weakness while price remains above its longer moving average.
Historical results 184 trades, 78% winners, a 0.7% average gain, a 2.8 profit factor, 3.9% CAGR, 8% exposure, and a 10% maximum drawdown.
The original write-up explicitly specifies next-open entries but is less precise about the execution timing of the exit and the counting convention for the ten-day stop. Those details need confirmation for exact replication. We do not assume that changing them leaves the reported results unchanged.
The two moving averages give the pullback a trend context. The test reported 8% exposure and a 10% maximum drawdown, which describe how often the position was held and how far the equity curve fell from its peak.
4. Normalized RSI on the S&P 500
Normalized RSI compares the current RSI reading with its own recent range. This provides a relative measure of weakness rather than relying only on a fixed raw RSI threshold.
Historical results 426 trades, 75% winners, a 0.5% average gain, a 2.2 profit factor, 6.1% CAGR, 18% exposure, and a 14% maximum drawdown.
The normalization formula needs a defined treatment if its denominator is zero; the original write-up does not state that convention. Its precise test dates and transaction costs also require confirmation. This is another pullback setup, so overlap with other oversold strategies matters when building a portfolio.
Scaling RSI against its own recent range lets the strategy identify weakness relative to recent readings. The test reported 426 trades and a 14% maximum drawdown, so a frequent historical rebound still came with stretches of losses.
5. VIX breakout with an RSI filter
This setup buys SPY when volatility rises sharply. The VIX supplies the signal; SPY is the instrument being traded.
Historical results 252 trades, 77% winners, a 0.75% average gain, a 2.5 profit factor, 5.5% CAGR, 10% exposure, and a 23% maximum drawdown.
The interpretation is a short-term rebound after a volatility shock, not a forecast that volatility must fall immediately. The original write-up specifies close-based entry but does not separately spell out the exit fill, precise sample dates, or trading costs.
The volatility signal and the instrument traded are separate. VIX identifies the shock, while the trade depends on how SPY responds. The test held positions 10% of the time and still experienced a 23% drawdown.
6. VIX Bollinger Band breakout
The second VIX setup measures how far volatility has moved relative to its own recent distribution.
Historical results 328 trades, 75% winners, a 0.5% average gain, a profit factor of 2, 5.2% CAGR, 13% exposure, and a 23% maximum drawdown.
This version produced more trades than the VIX breakout with the RSI filter in the original write-up. Both can respond to the same market selloff, so combining them does not automatically diversify risk. Exact dates, cost treatment, and exit execution need to be confirmed for replication.
A band adapts to recent variation in VIX. This version produced more trades than the RSI-filtered VIX setup in the reported tests, but both can respond to the same selloff. Compare trade dates to see how often their positions overlap.
7. One-day range-band and IBS reversal
This short holding-period setup combines a pullback from a recent high with a weak finish inside the day’s range.
Historical results 457 trades, 62% winners, a 0.4% average gain, a 1.9 profit factor, 5.5% CAGR, 5% exposure, and a 15% maximum drawdown.
Although the original write-up calls its range measure ATR, the written calculation uses high minus low. That differs from standard true range, which also incorporates the previous close. Replacing one with the other would change the rules. This is a close-to-close trade, so it includes both overnight and next-session risk.
The range band measures the retreat from a recent high. Internal Bar Strength measures where price finished within the session. The reported 0.4% average includes both overnight and next-session returns under the close-to-close convention.
8. Three down closes, then a one-day hold
This is one of the simplest price-only SPY mean-reversion strategies in the collection.
Historical results 714 trades, 62% winners, a 0.26% average gain, a 1.7 profit factor, 5.5% CAGR, 8% exposure, and a 17% maximum drawdown.
The average gain per trade is modest, making trading costs particularly relevant. The original write-up does not supply a detailed cost model or exact sample dates. A short holding period does not remove gap risk, and three down days can be followed by a fourth.
The fixed holding window isolates the first session after a sequence of losses. With an average gain of 0.26%, the difference between the modeled fill and the actual fill can account for a meaningful share of the result.
9. Monday weakness
This setup combines mean reversion with a weekday filter. It asks for weakness on Friday followed by more weakness on Monday.
Historical results 288 trades, 79% winners, a 0.9% average gain, a 3.9 profit factor, 7.8% CAGR, 11% exposure, and a 16% maximum drawdown.
The original rules describe the signal conditions but do not explicitly state order execution timing. That is an important replication detail. The weekday condition also means holiday handling should be defined before testing.
The weekday condition narrows this test to weakness around the start of the trading week. Compare its position dates with the other SPY pullbacks to see whether several strategies would buy the same decline.
10. Connors-style RSI on QQQ
This QQQ setup combines a fast oversold signal with a previous-high exit. It uses the two-period RSI, not the separate composite indicator known as Connors RSI.
Historical results 321 trades, 71% winners, a 0.9% average gain, a 2.1 profit factor, 10.7% CAGR, 18% exposure, and a 23% maximum drawdown.
The original write-up emphasizes the challenge of executing signals based on the final close and notes that next-open entries can weaken performance. Its test dates and costs are not fully specified in the text. The results belong to this particular adaptation and should not be presented as results for every strategy associated with Larry Connors.
This QQQ setup uses short-term weakness to enter and a recovery in price to exit. A price-based exit gives some rebounds longer to develop, so the trade count alone tells you little about time invested.
11. QQQ RSI with EMA and rolling volume-weighted price
This strategy requires short-term weakness while the broader trend is rising. It also asks that QQQ trade below a recent volume-weighted reference price.
Historical results, March 1999–September 2026: 215 trades, 79.5% winners, a 0.94% average return, a 3.54 profit factor, and a 9.1% maximum drawdown. Results exclude commissions, slippage, taxes, and other trading costs.
The test used a fixed $100,000 position per trade, and the reported drawdown is measured against the initial $100,000. It is not directly comparable with a fully compounded equity drawdown. The original write-up specifies the exit condition but does not clearly state its execution price.
This is a daily rolling volume-weighted price, not intraday session VWAP. The original write-up also reports testing many parameter combinations. Its 2018–2026 subperiod had a lower profit factor of 2.66, a useful reminder that performance varied over time.
The rising average supplies the trend context while the rolling volume-weighted price gives the pullback a separate reference point. The combination tests weakness relative to both momentum and recent trading activity.
12. RSI plus Internal Bar Strength for Nasdaq stocks
This stock strategy combines an oversold RSI with a close near the bottom of the day’s trading range. A trend filter restricts entries to stocks above their longer-term moving average.
Historical results 1,321 trades, 68% winners, a 1.1% average gain, a profit factor of 2, 11% CAGR, 16% exposure, and a 17% maximum drawdown.
The original write-up used Norgate data including delisted stocks and reports a 0.03% allowance for commissions and slippage. The precise charging convention, test dates, and ranking rule when more than five stocks qualify are not stated in its text.
The stock screen can produce several candidates at once. The original backtest included delisted stocks. A replication also needs a consistent way to choose among qualifying stocks when the portfolio has too few open slots.
How to compare mean reversion backtests
Start with what creates the signal. A two-day RSI reading reacts to recent closes, while Internal Bar Strength describes where price finished within one session. A VIX spike can identify broad stress. During a sharp selloff, several of these conditions can occur together.
Next, compare the exit. A one-session hold limits time in the trade. A previous-high exit gives a rebound time to develop and can hold longer through weakness. Test the entry and exit at prices you can reasonably execute and include trading costs.
Portfolio overlap matters. Several strategies here buy U.S. equity weakness. Check whether they enter together and what happens when their drawdowns overlap before assigning capital to more than one.
Want More Backtested Trading Strategies?
We publish rule-based trading research, systematic market observations, and new trading strategies for traders who prefer evidence over opinions.
Join our Skool community, Rule-Based Trading: 👇
skool.com/rulebasedtrading/a…
We add new strategy research daily and discuss how systematic traders can turn market ideas into rules that can actually be tested.
🤖 Made with AI

Concretum Bands short entry strategy on NQ coded using @buildalpha


Latest @buildalpha was connected to Claude through MCP and a custom python signal for Concretum bands by @ConcretumR was created inside BA. Build alpha simulated various exits and provided this equity graph for NQ long during NY session with probably better stats than original.


QuantGlobal retweeted

🚨BREAKING: New Python Library for Algorithmic Trading with AI
It's called Ziplime (*not* Zipline).
This is what you need to know:


Latest @buildalpha was connected to Claude through MCP and a custom python signal for Concretum bands by @ConcretumR was created inside BA. Build alpha simulated various exits and provided this equity graph for NQ long during NY session with probably better stats than original.
The latest release of @buildalpha has MT5 data import with a click, Prop firm simulator and MCP for connecting the Claude of Codex... 2026 has been a big year for @Dburgh
Here is a DAX strategy made for MT5 based on London Breakout made on Build alpha.
My Darwinex curve so far


Playing with Kronos forecasting model, it rpedicts a ralley in NQ from here till Dec end..
github.com/shiyu-coder/Krono…

133


So many open source Grok bots available now..

Proving that open source can make money.
Rakazo.com is the best open-source Grok Bot alternative.
It's free to self-host and customise.
Bring any LLM and any sandbox provider.
So how does it make money?
By offering cloud hosting starting at $15/mo. Bring your own API key or subscription.
It's live on the App Store, Play Store, Mac, Windows and web: rakazo.com
Looking to join a thriving open-source community?
Join us on Discord: discord.gg/RWwKa2Sn7h
And follow on X: @rakazobot

89
QuantGlobal retweeted

Weekend hack: HackerTube. I was annoyed with YouTube's recommendations so I had Claude filter down 43M comments over 20 years of HN to 6,454 videos that keep being recommended. *Significantly* better viewing experience, ~2 hours with Opus 5.5:
hackertube.org/
- Excellent recs without any logins (state is kept in local browser session)
- Thumbnail is a representative frame from middle of the video instead of the super duper A/B test hyper-optimized user uploads
- Underlying data from the comment analysis as one zip file, point your Claude at it and ask for your own version
- HackerTube Longs ✊
A bit more on the process:
I use Claude Code (desktop app for Mac), Opus 5.5 on Medium effort as my default. I only talk to Claude and have it do everything, the only "manual work" I helped with in tandem was in the browser (reminiscent of MenuGen): 1) I had to create some kind of API key from Google Cloud UI to query YouTube for video metadata, 2) I booted up a VPS box for serving and 3) I bought the domain name. Once the box was up I gave Claude the IP and told it update, secure, harden, deploy and optimize the code, and it did the whole thing.
Many awesome projects that would have normally taken weeks/months even can now be few-shotted for breakfast. What else are we not thinking of.


QuantGlobal retweeted

i found this cheatsheet in one private quant forum.
you know 3 regimes, but jane street quants knows 15.
15 regimes. 15 math formulas.
Save it. Use this rare sheet before creating any trading strategy.

ALT regime-cheatsheet


QuantGlobal retweeted

This guy used Ray-Ban Meta Smart Glasses, AI, and a MacBook to cheat at chess game.
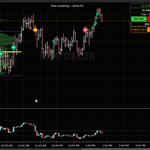
Long at 7700 after a strong selling absorption seen at 7690. Then short at 7710 after ES rallied with CDV showing exhaustion of buyers at VA High

70


QuantGlobal retweeted
One prompt in quantitative trading created more alpha than most Fortune 500 trading desks:
"Reverse Engineer Regime Strategy"
3 lanes. 9 validation gates. 0 live trading without paper-trading PASS.
Bookmark this.

ALT REA-TRADER