

NQ, ES & Gold futures | Probability over opinion | ICT + backtests | TradingView indicators | https://nitter.cf/t.co/pruz2NQ6Tu | https://nitter.cf/t.co/7xIEUoPhSw
- Tweets19.9K
- Following233
- Followers13.7K
- Likes31.3K






ALT Herman Trading educational graphic showing a 62% short directional bias on NQ during the London session. An original TradingView replay screenshot accompanies the message that probability selects the trading side while confirmation determines the entry.

ALT Herman Trading graphic, dark, 16:9: "Claude + TradingView", "6 real trading prompts", "AI-assisted market research". On the left a glowing head outline with the lines Analyze, Find patterns, Challenge assumptions, Improve your edge, and a prompt bar "Ask anything about the markets..."; in the middle "AI + markets = insights"; on the right a candlestick chart with an "Alert, potential setup detected" badge. Six numbered tiles along the bottom: 1 Analyze markets, 2 Find setups, 3 Manage risk, 4 Backtest ideas, 5 Interpret data, 6 Improve decisions. "Herman Trading, @rherman" at the bottom. Using Claude with TradingView data to test NQ trading ideas.


ALT White editorial with orange accents, Herman Trading graphic in 4:5. Label: How the filter works. Headline: 30 of 246 survived. Two cards: 246 trade versions tested; 145 profitable in 2015-21 and 2022-26. A large 30: PF 1.2+ in both periods, and 8+ profitable years. Luck check: plays found at 08:00 NY: 69 on real data; 1.2 on shuffled filters, average. Source: Herman Trading Backtesting Centre, NQ Session Study v2 (nq-session-study-v2), 2015-2026. Herman Trading backtesting method on NQ futures: plays found on 2015-2021, checked out of sample on 2022-2026 and compared with shuffled filters.


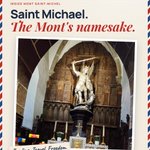
ALT Travel postcard style graphic in 4:5: cream paper with a red, white and blue airmail border, the Herman Trading wordmark and a PAR AVION stamp at the top. The red label "Inside Mont Saint-Michel" sits above the headline "Saint Michael. The Mont's namesake.", the second line in red italic script. Below, a tilted postcard photo of the silver statue of the archangel Saint Michael with wings and a crown, sword raised, standing on a dragon, in front of a carved wooden altarpiece under a white stone arch, with candles and an altar below. A handwritten paper note in the corner reads "Trading. Travel. Freedom." Footer: www.hermantrading.pro.

ALT White editorial with orange accents, Herman Trading graphic in 4:5. Label: Gold, every year since 2015. Headline: Above expected 12 of 12 years. A large 92.2%: Asia high taken first, 103 days, 2022-2026. Chips: Expected from distance 75.1%, 2015-2026: 90.0% of 230 days, About 1.6 days a month. A bar chart per year with a line for the expected rate: 2015 83, 2016 97, 2017 87, 2018 92, 2019 88, 2020 79, 2021 93, 2022 75, 2023 100, 2024 93, 2025 94, 2026 90 percent. Source: Herman Trading Backtesting Centre, GC Session Study v2 (gc-session-study-v2), 2015-2026, days London took an Asia level, with an Asia-session filter at 02:00 NY. A gold futures (GC) session study from Herman Trading backtesting: which side of the Asia range London takes first.

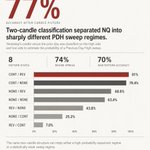
ALT Herman Trading study card, light background. Big red "77%", "Accuracy after candle filters", and the title "Two-candle classification separated NQ into sharply different PDH sweep regimes." Key figures: 8 pattern states, 74% regime spread, 70% raw pattern accuracy. Horizontal bars for the chance of a Previous Day High sweep: CONT / REV 81%, CONT / NONE 79.4%, NONE / REV 68.8%, NONE / NONE 63.4%, REV / NONE 43.8%, NONE / CONT 25.2%, REV / CONT 7.0%. Note: the same two-candle structure can imply a high-probability expansion regime or a weak sweep regime. Legend: CONT = continuation, REV = reversal, NONE = no prior-extreme test. NQ futures study 2015-2025.

ALT Dark EVIDENCE-style Herman Trading graphic in 4:5. Header: NQ1! 1H, concept sketch, not real prices, and in amber: 1 in 426 missed both. A drawn candlestick sketch rises from left to right. Near the right edge a small narrow candle sets dashed amber lines labelled 8:00 high and 8:00 low. The next candle is wide and trades through both lines inside an amber box. Three numbered amber markers point at the chart: 1 narrow 8:00, 2 high taken, 3 low taken. The caption bar reads: 9:00 missed both sides, 1 in 426 in amber. What do you mark first? Three options: 1 8:00 high, 2 8:00 low, 3 Both, with Reply 1, 2 or 3. Herman Trading and hermantrading.pro in the footer. It illustrates an NQ futures backtest: after a narrow 8:00 ET hourly candle, the 9:00 hour almost always takes its high, its low or both.

ALT Herman Trading Trade Facts card styled like a food nutrition label. Headline: Read the label before you trade it. Serving size 1 trade, 100 per sample. Win rate 40%, average win 2.0R, average loss 1.0R, breakeven win rate 33.3%, profit factor 1.33, expectancy +0.20R, after costs of 0.1R per trade +0.10R. Chance of 5 or more losses in a row: 98%. Note: illustrative math, not a backtest.

ALT Phone screenshot of the TradingView Blog. A black SOCIAL label sits above the headline: Marketplace update: More flexibility and features are coming, dated Oct 27. Below it is a dark banner with a glowing purple edge: on the left a button reading Indicator marketplace with a shopping bag icon, on the right a card titled Terms of Use, Policies, and Disclaimers with small legal text. Under the banner the article begins: A month ago, we shared our plans to make selling indicators and strategies on TradingView clearer and more transparent. Since then, we've received a wealth of thoughtful suggestions and positive feedback. Context: TradingView's 27 October 2026 update for vendors of invite-only indicators and Pine Script strategies, explaining that updated Marketplace terms are coming and nothing changes on November 1.
